Hi, this is a SaaS system shipped by Tencent
A customization feature that enables traffic operators to make precise decisions in order to mitigate traffic congestion.
My Role
Product designer
Contribution
User Research: Competitive Analysis, User Interviews, User Research
UX design: User Flow, Wireframing, Prototype, Usability Testing
Duration:
4 weeks Product Design, 9 weeks Development and 2 weeks Test.
Team: 10+ members
1 Product Manager,
1 Product Designer(me),
1 Visual designer,
3 Engineers, 2 Database engineers, 2 machine learning engineers and 1 Project Manager
CONTEXT
V1.1 HAS NO CLIENT

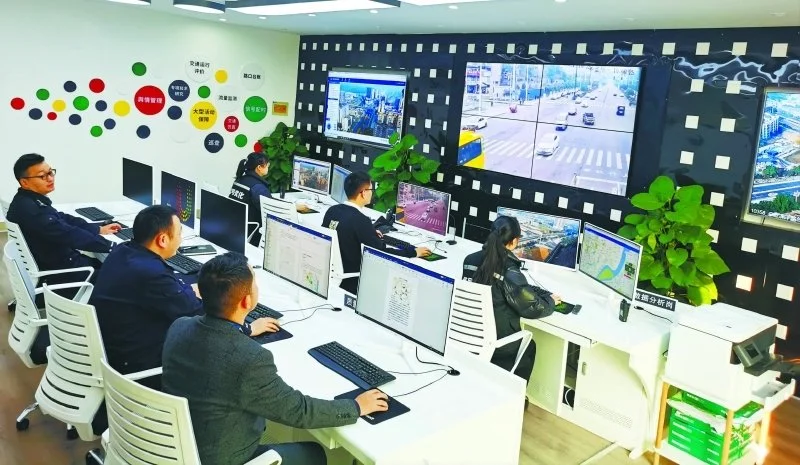
What is Traffic Status:
Traffic Status is a SaaS system using floating car data to measure, monitor, and predict traffic conditions.
Why do clients(Operators and policemen in Traffic department) need Traffic Status?
Quantify the KPI for traffic police officers via metrics improvement.
Prioritize which congestion spots require action through comparing and temporal data.
Improve traffic conditions by adjusting traffic lights and dispatching policemen.
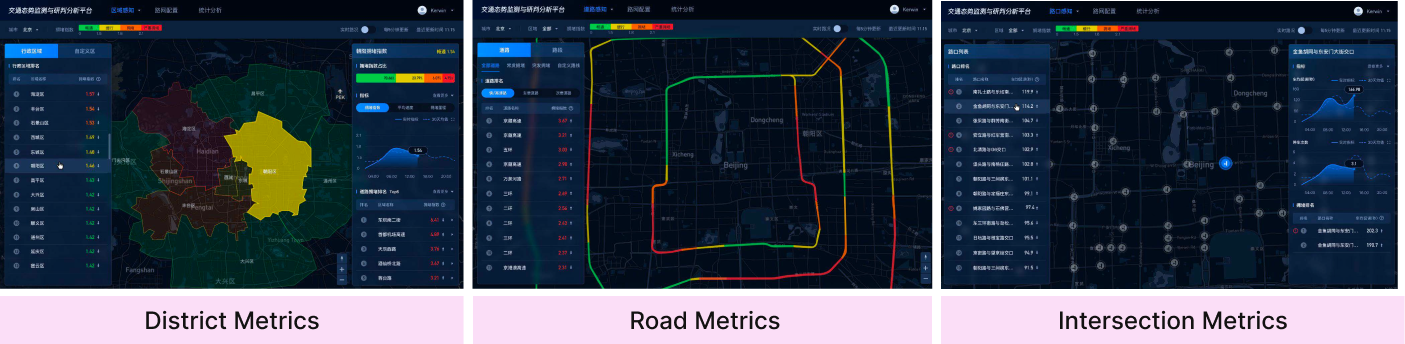
With Traffic Status V1.1, all metrics in various granularity are generated. But we still have no client.
Users’ problem with V1.1:
Users can not leverage the system to make decisions and improve their KPIs (traffic congestion metrics).
We have launched Traffic Status Version 1.1, which contains all the basic metrics and features of a traffic monitoring system. Based on the feedback of the pre-sale team, we already knew that potential clients were not 100% motivated to subscribe to our products because they didn’t think our product was usable enough for their real-life workflow.
THE CHALLENGE
DESIGN CHALLENGE FOR V1.2
“Metrics are generated and visualized, but how can we empower operators to leverage those metrics in their workflow to improve traffic congestion?”
Business Goal for V1.2:
For version V1.2, our business goal is to get customers and gain revenue.
Integrate our system into their workflow.
Facilitate clients to reach their goals, improve their KPIs and let clients understand our value.
The outcome:
We shipped out our SaaS system. From this version, we got 2 clients and 6+ potential clients within 3 months(before I left). Revenue was 4 Million RMB/year, with trends growing to 16 million RMB/year.
THE SOLUTION
A CUSTOMIZATION TOOL
THAT ALLOWS OPERATORS TO INTUITIVELY CROP THE DATASETS THEY NEED
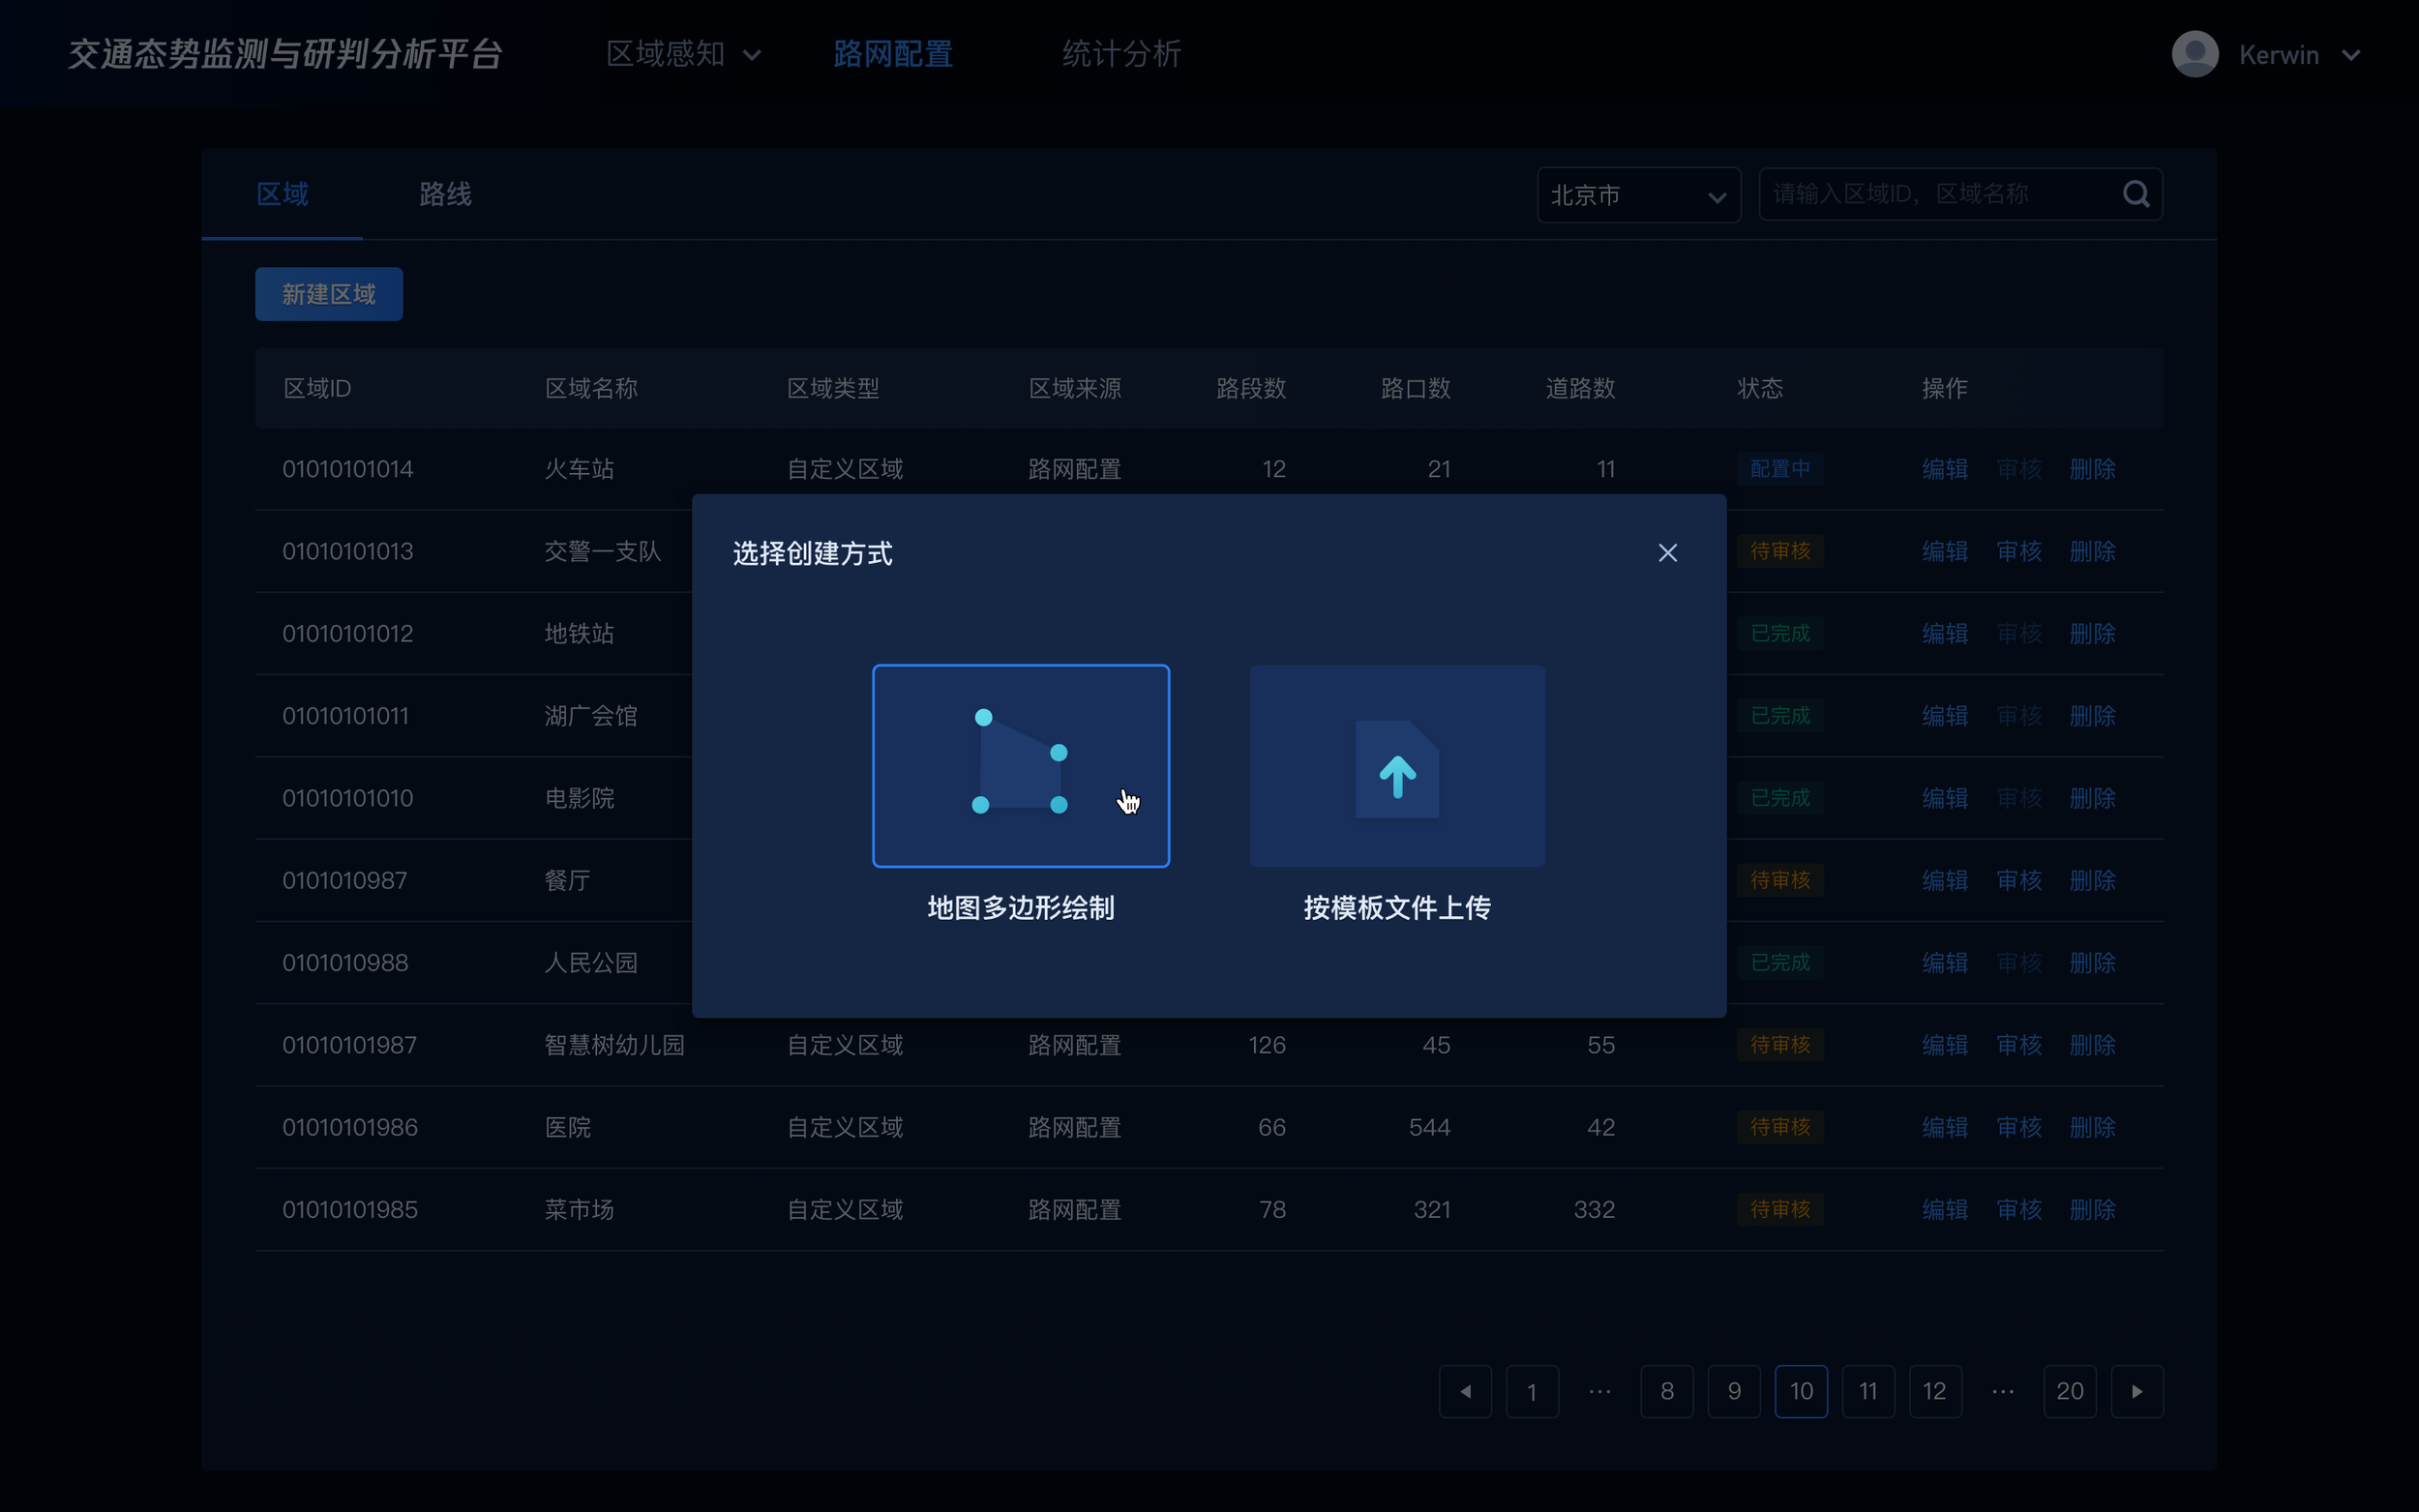
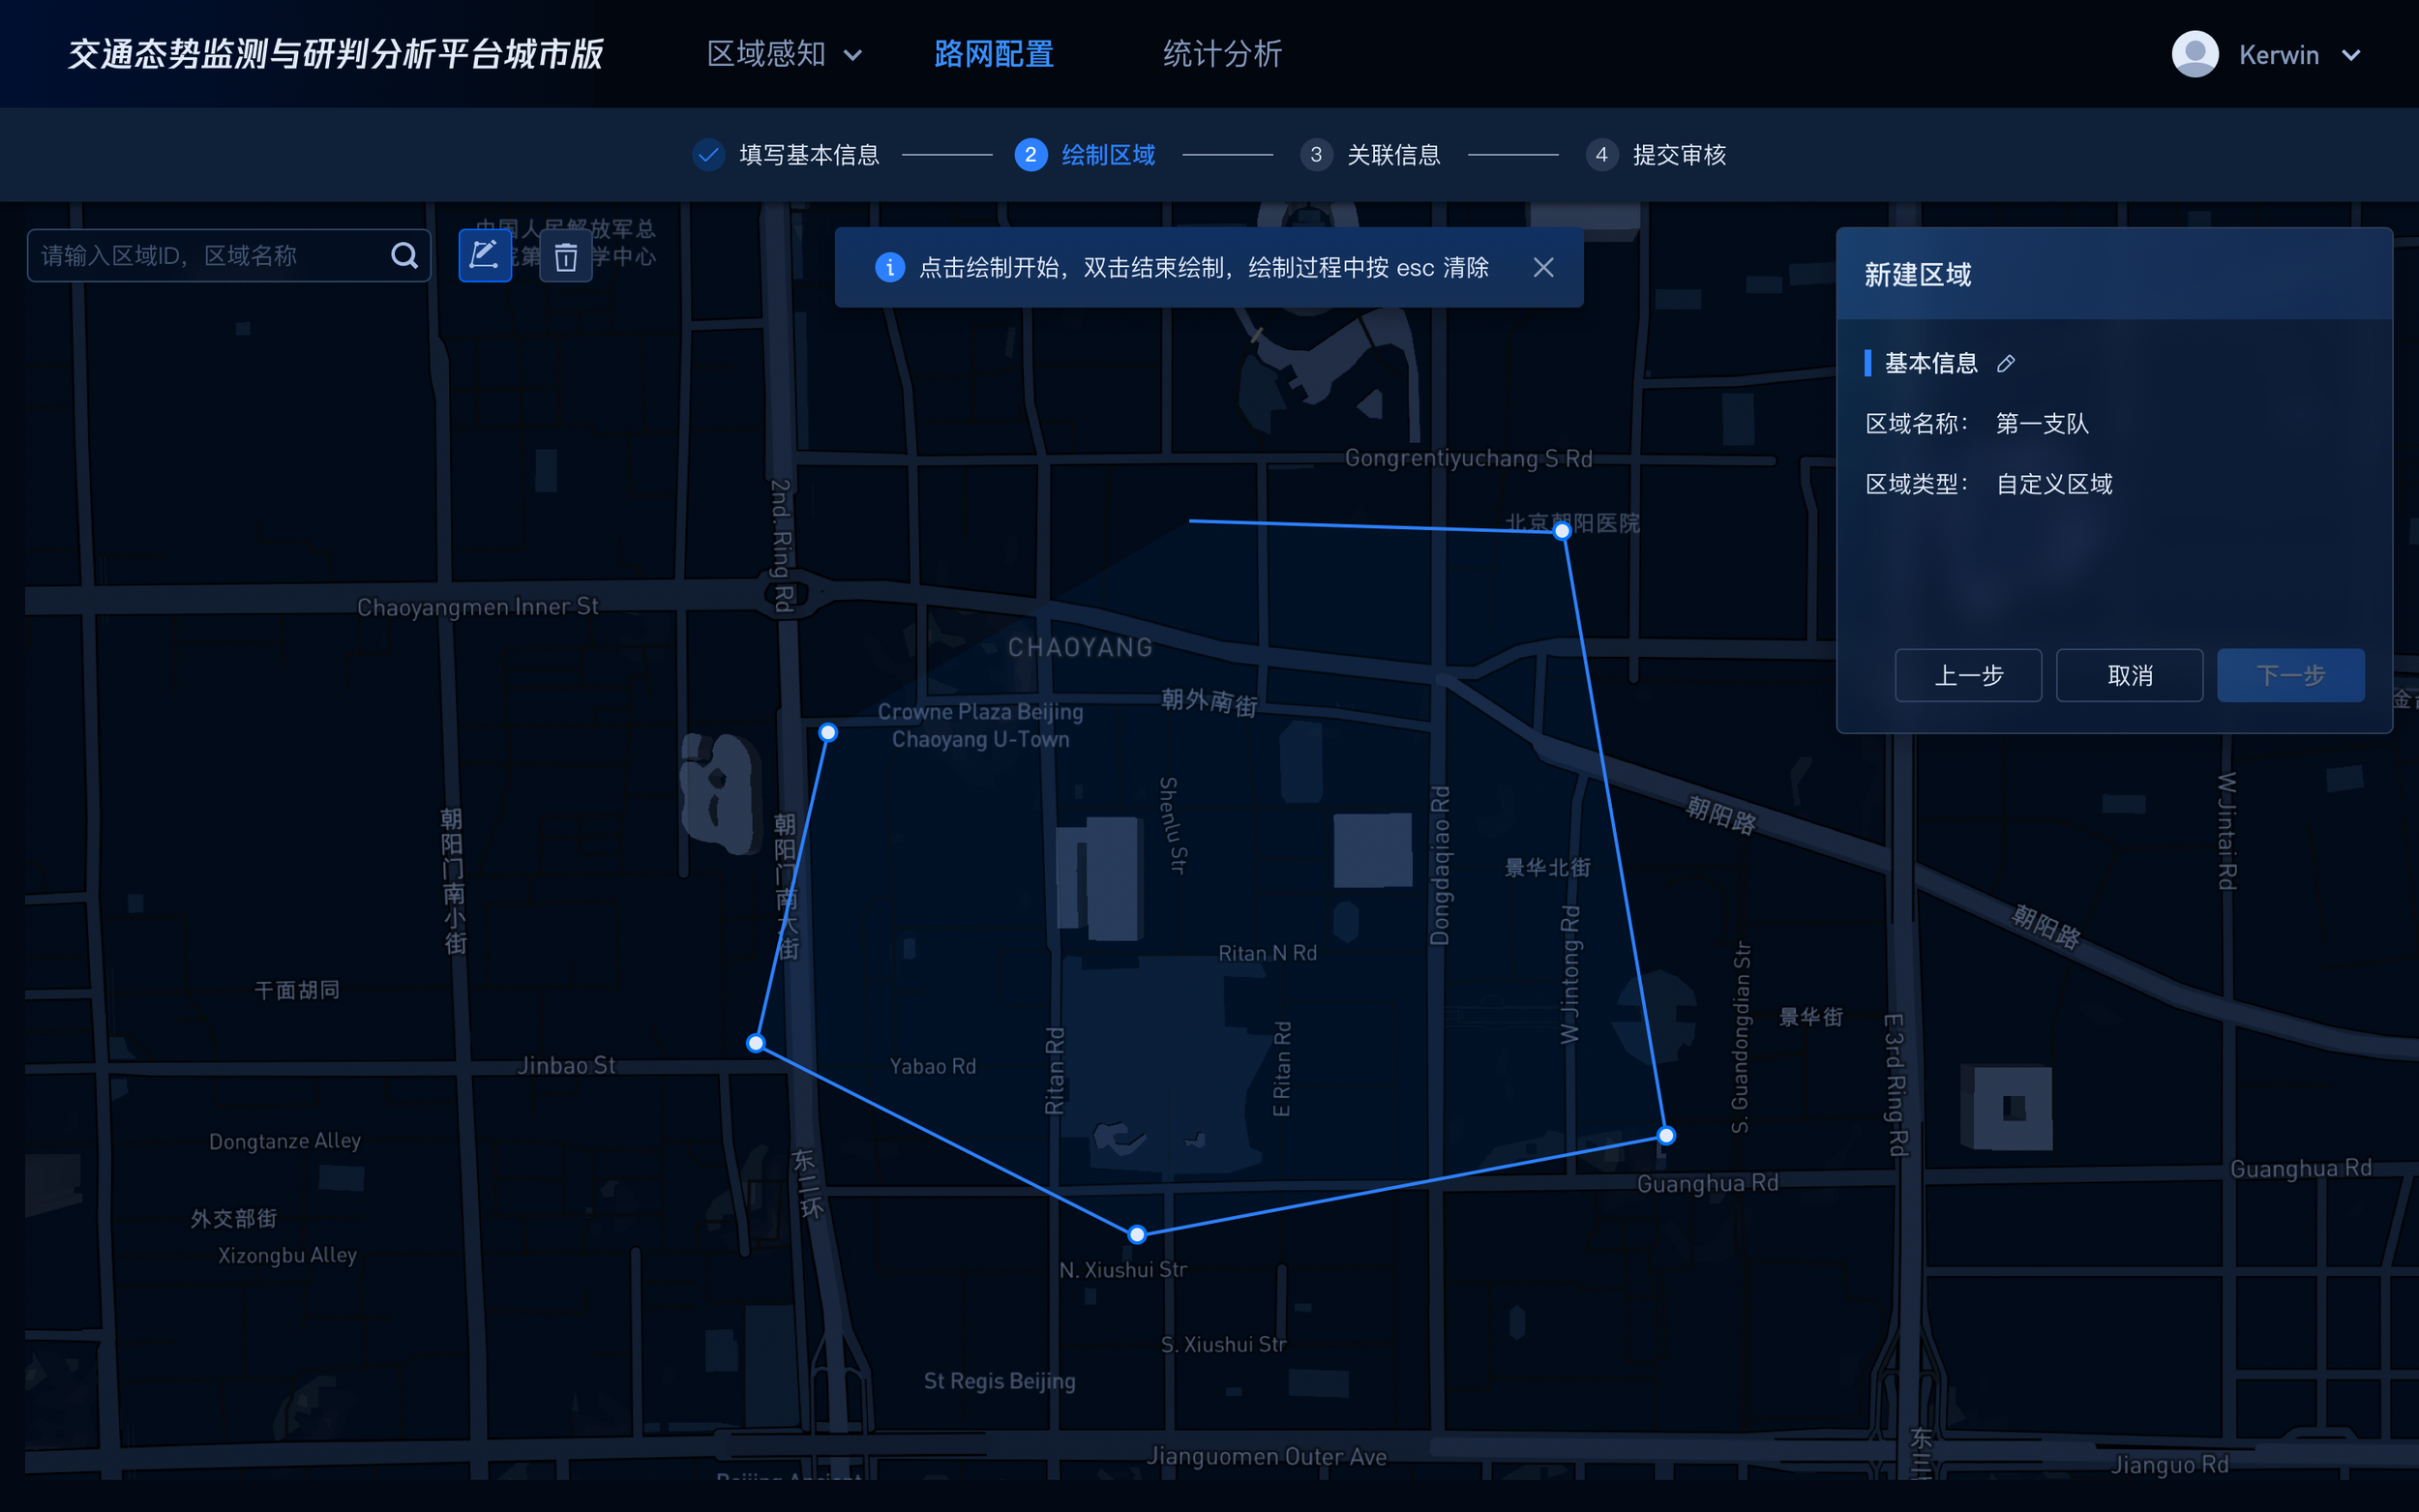
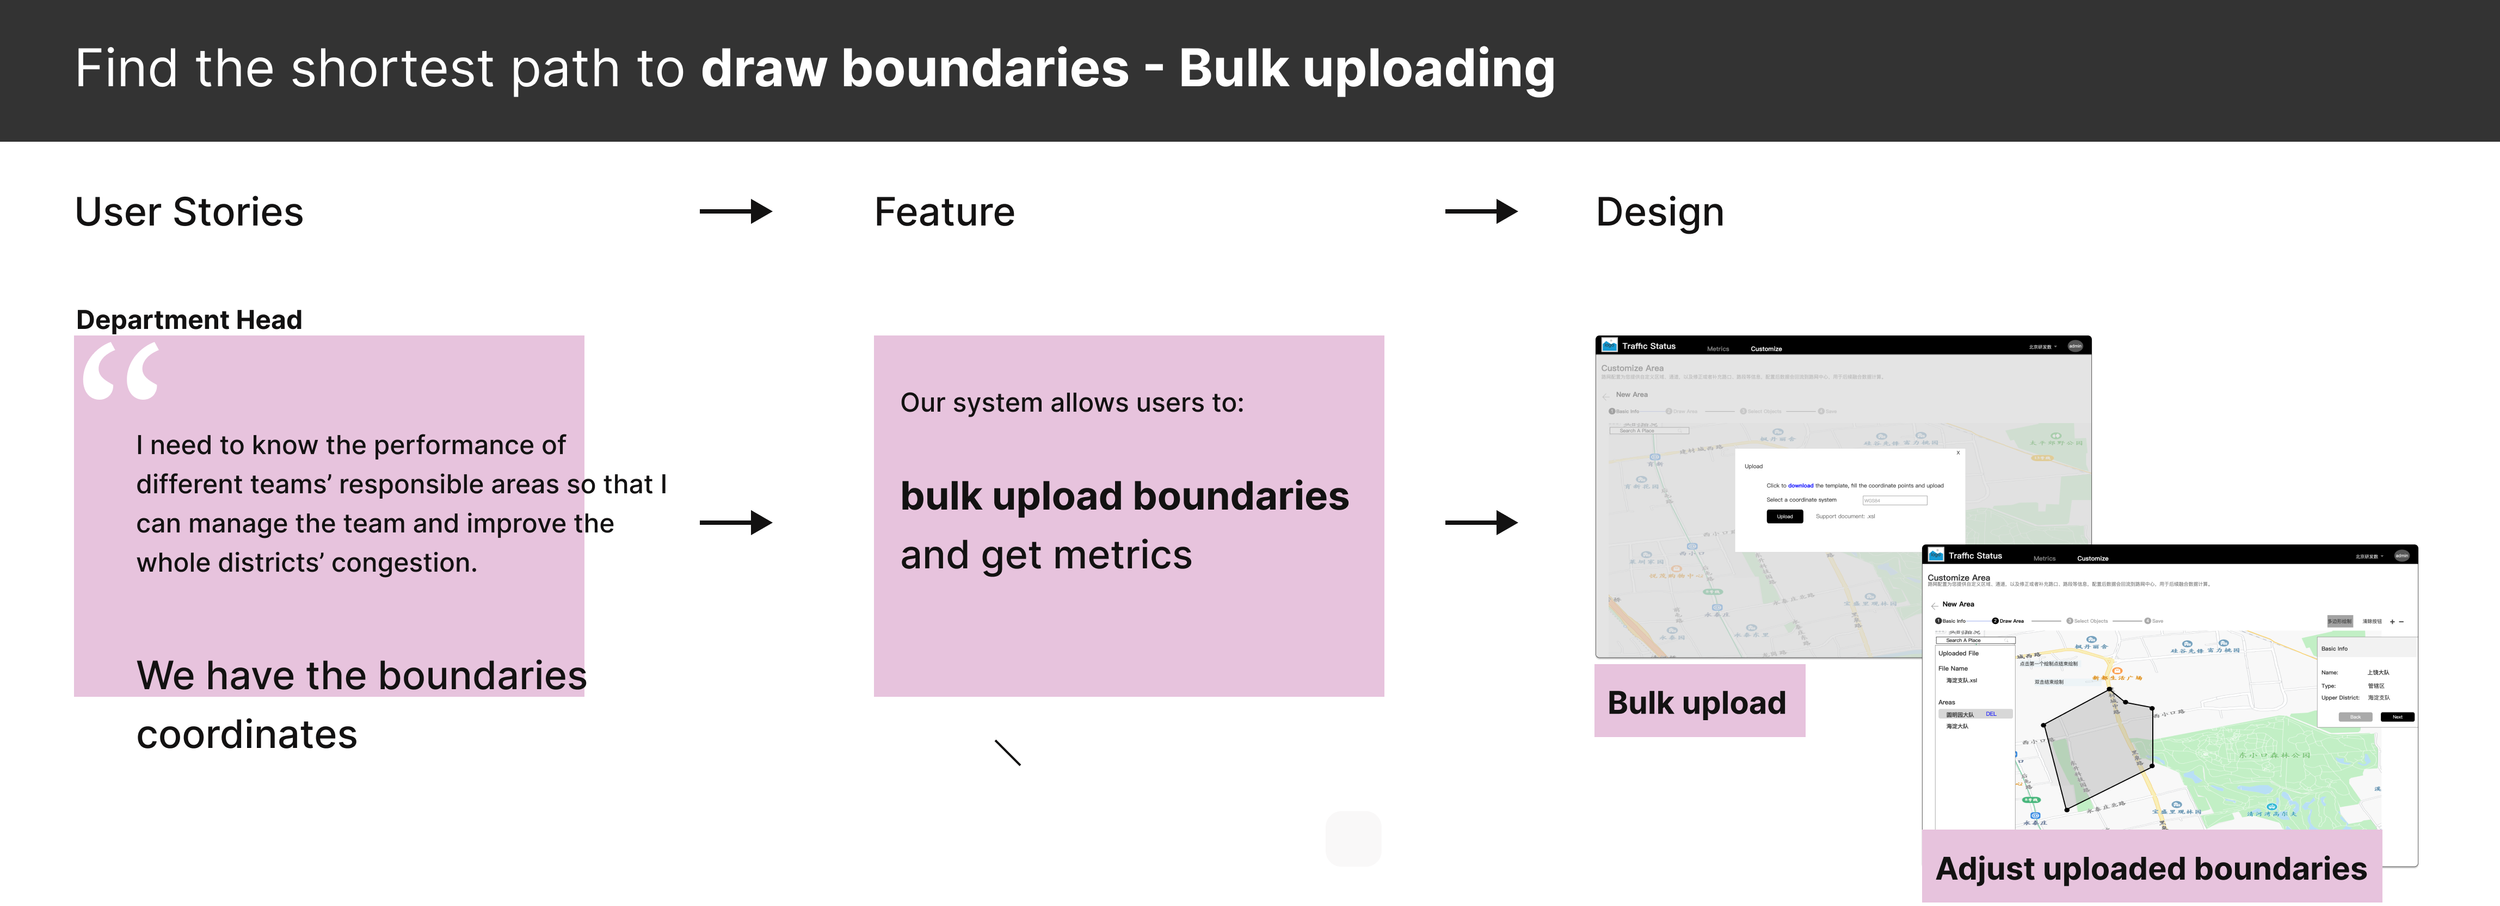
Customization:
Draw boundary
Let user create a new area by drawing boundaries
Rational: Familiar and easy
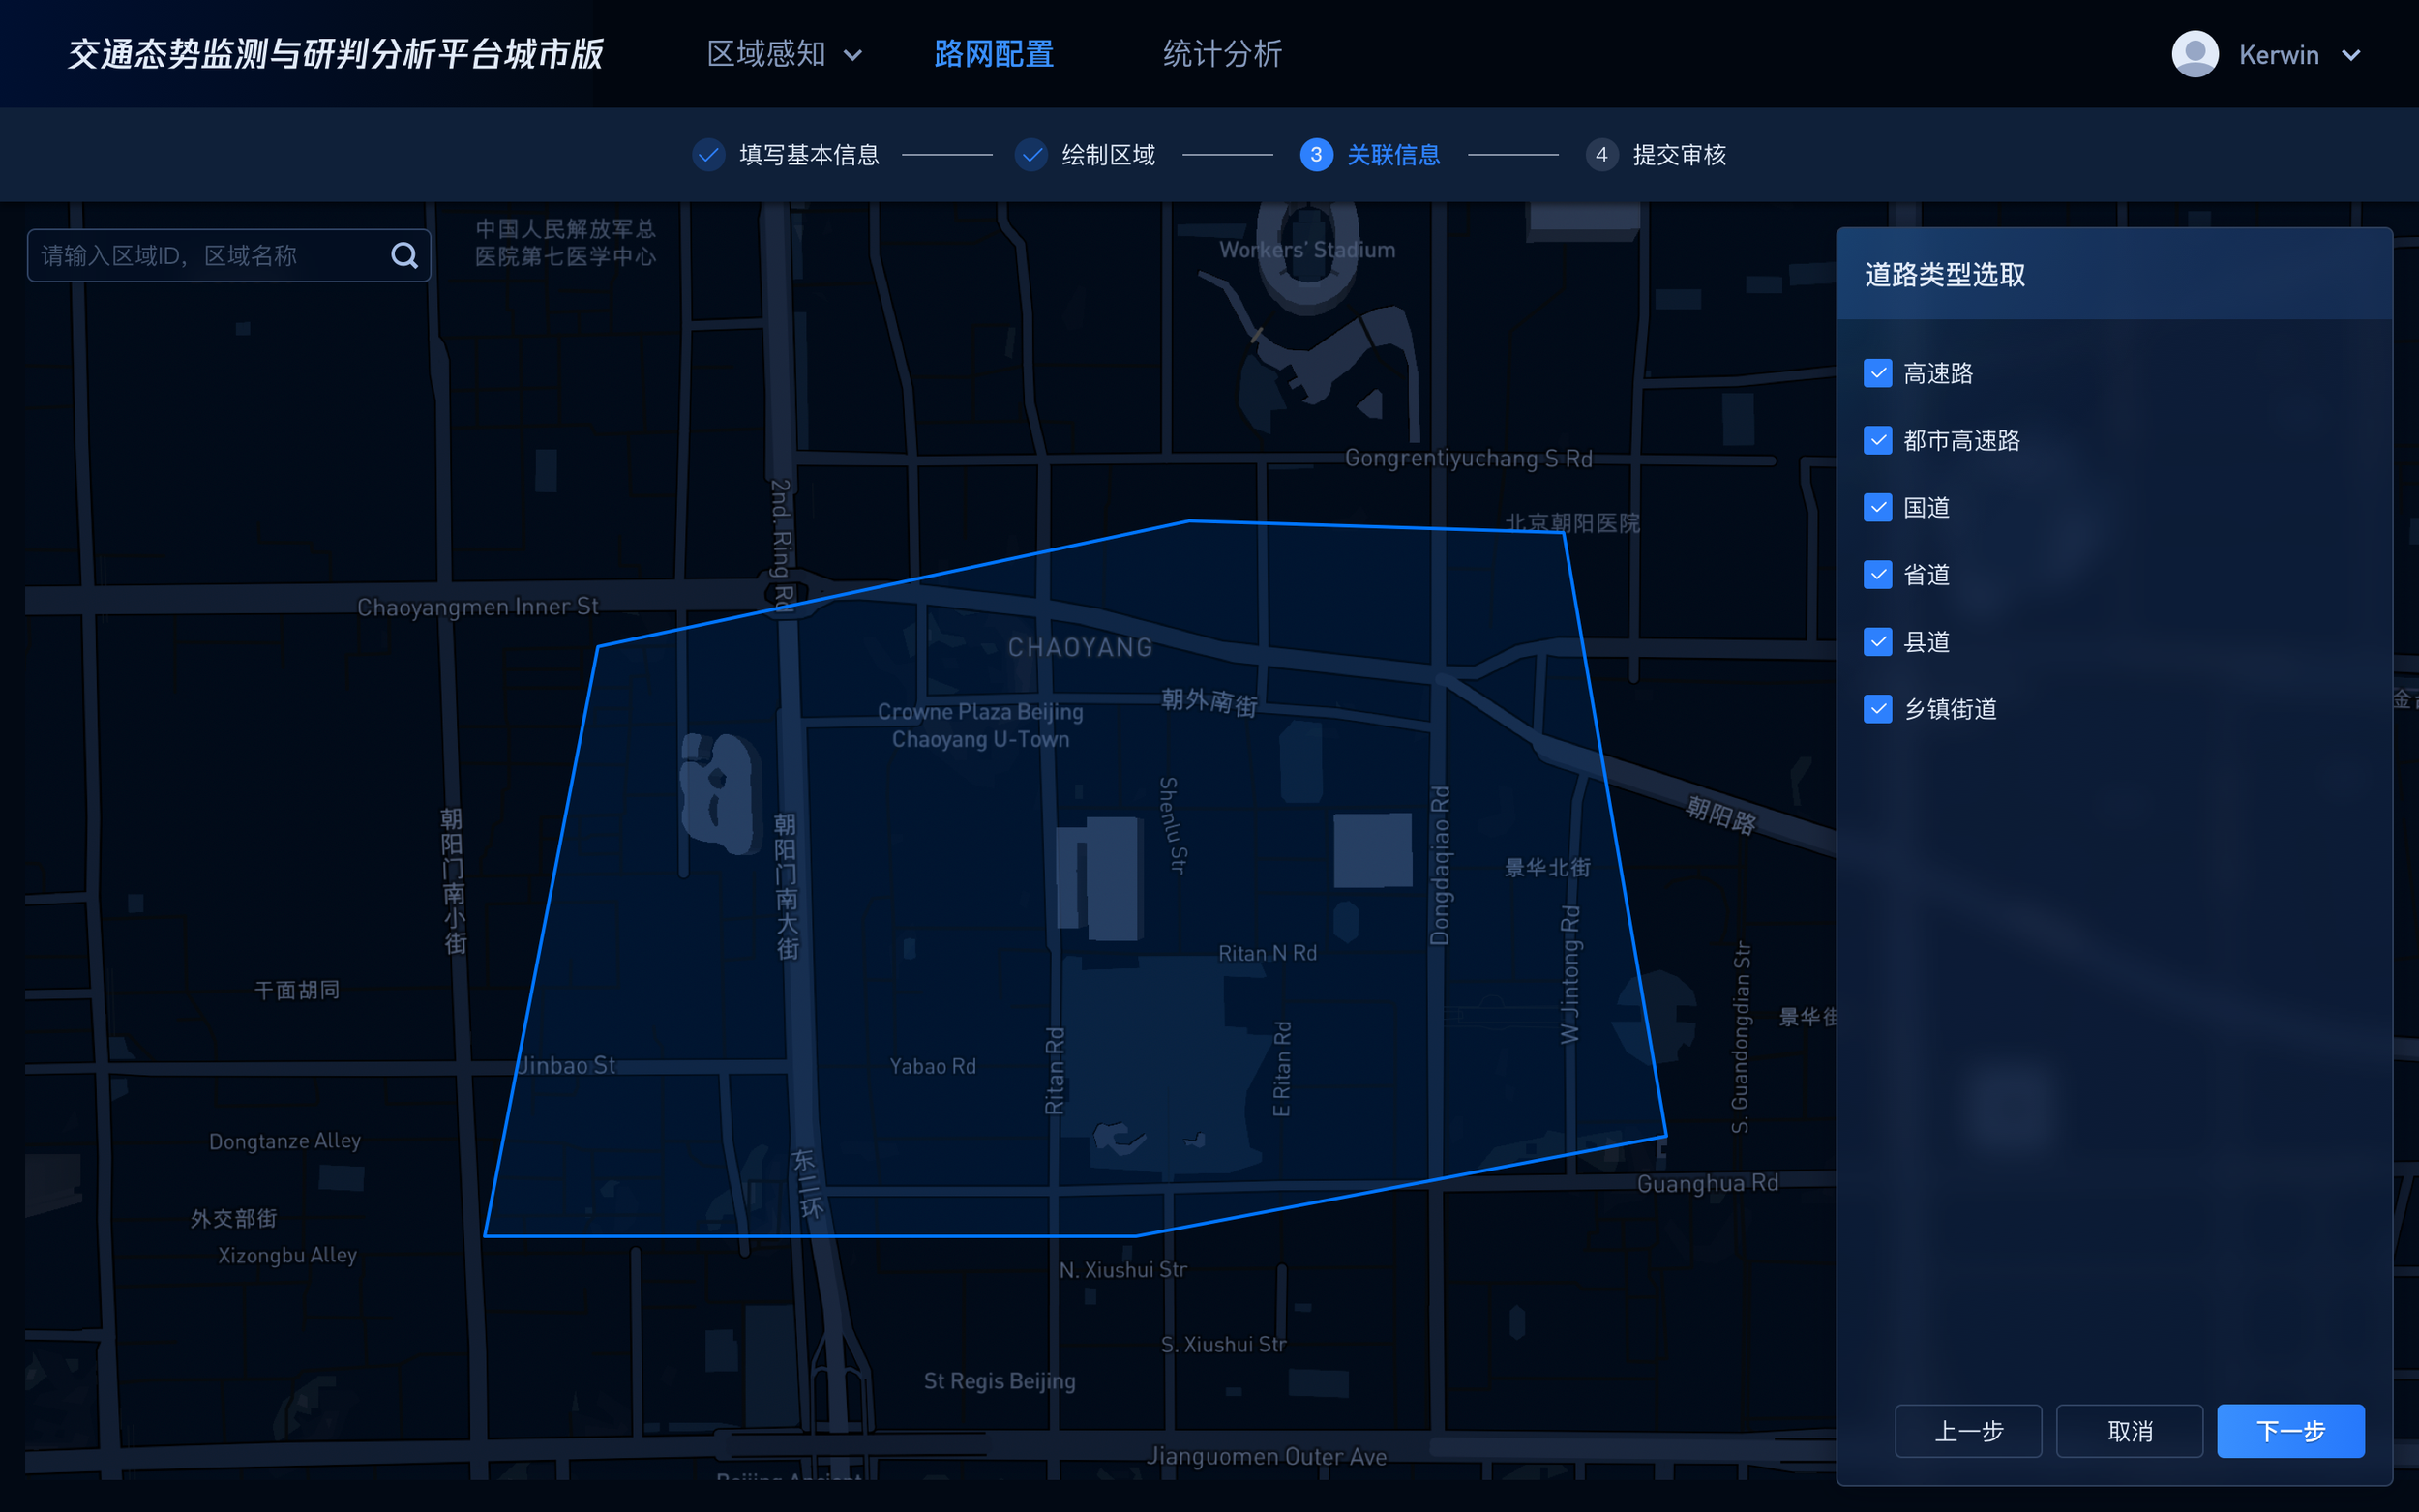
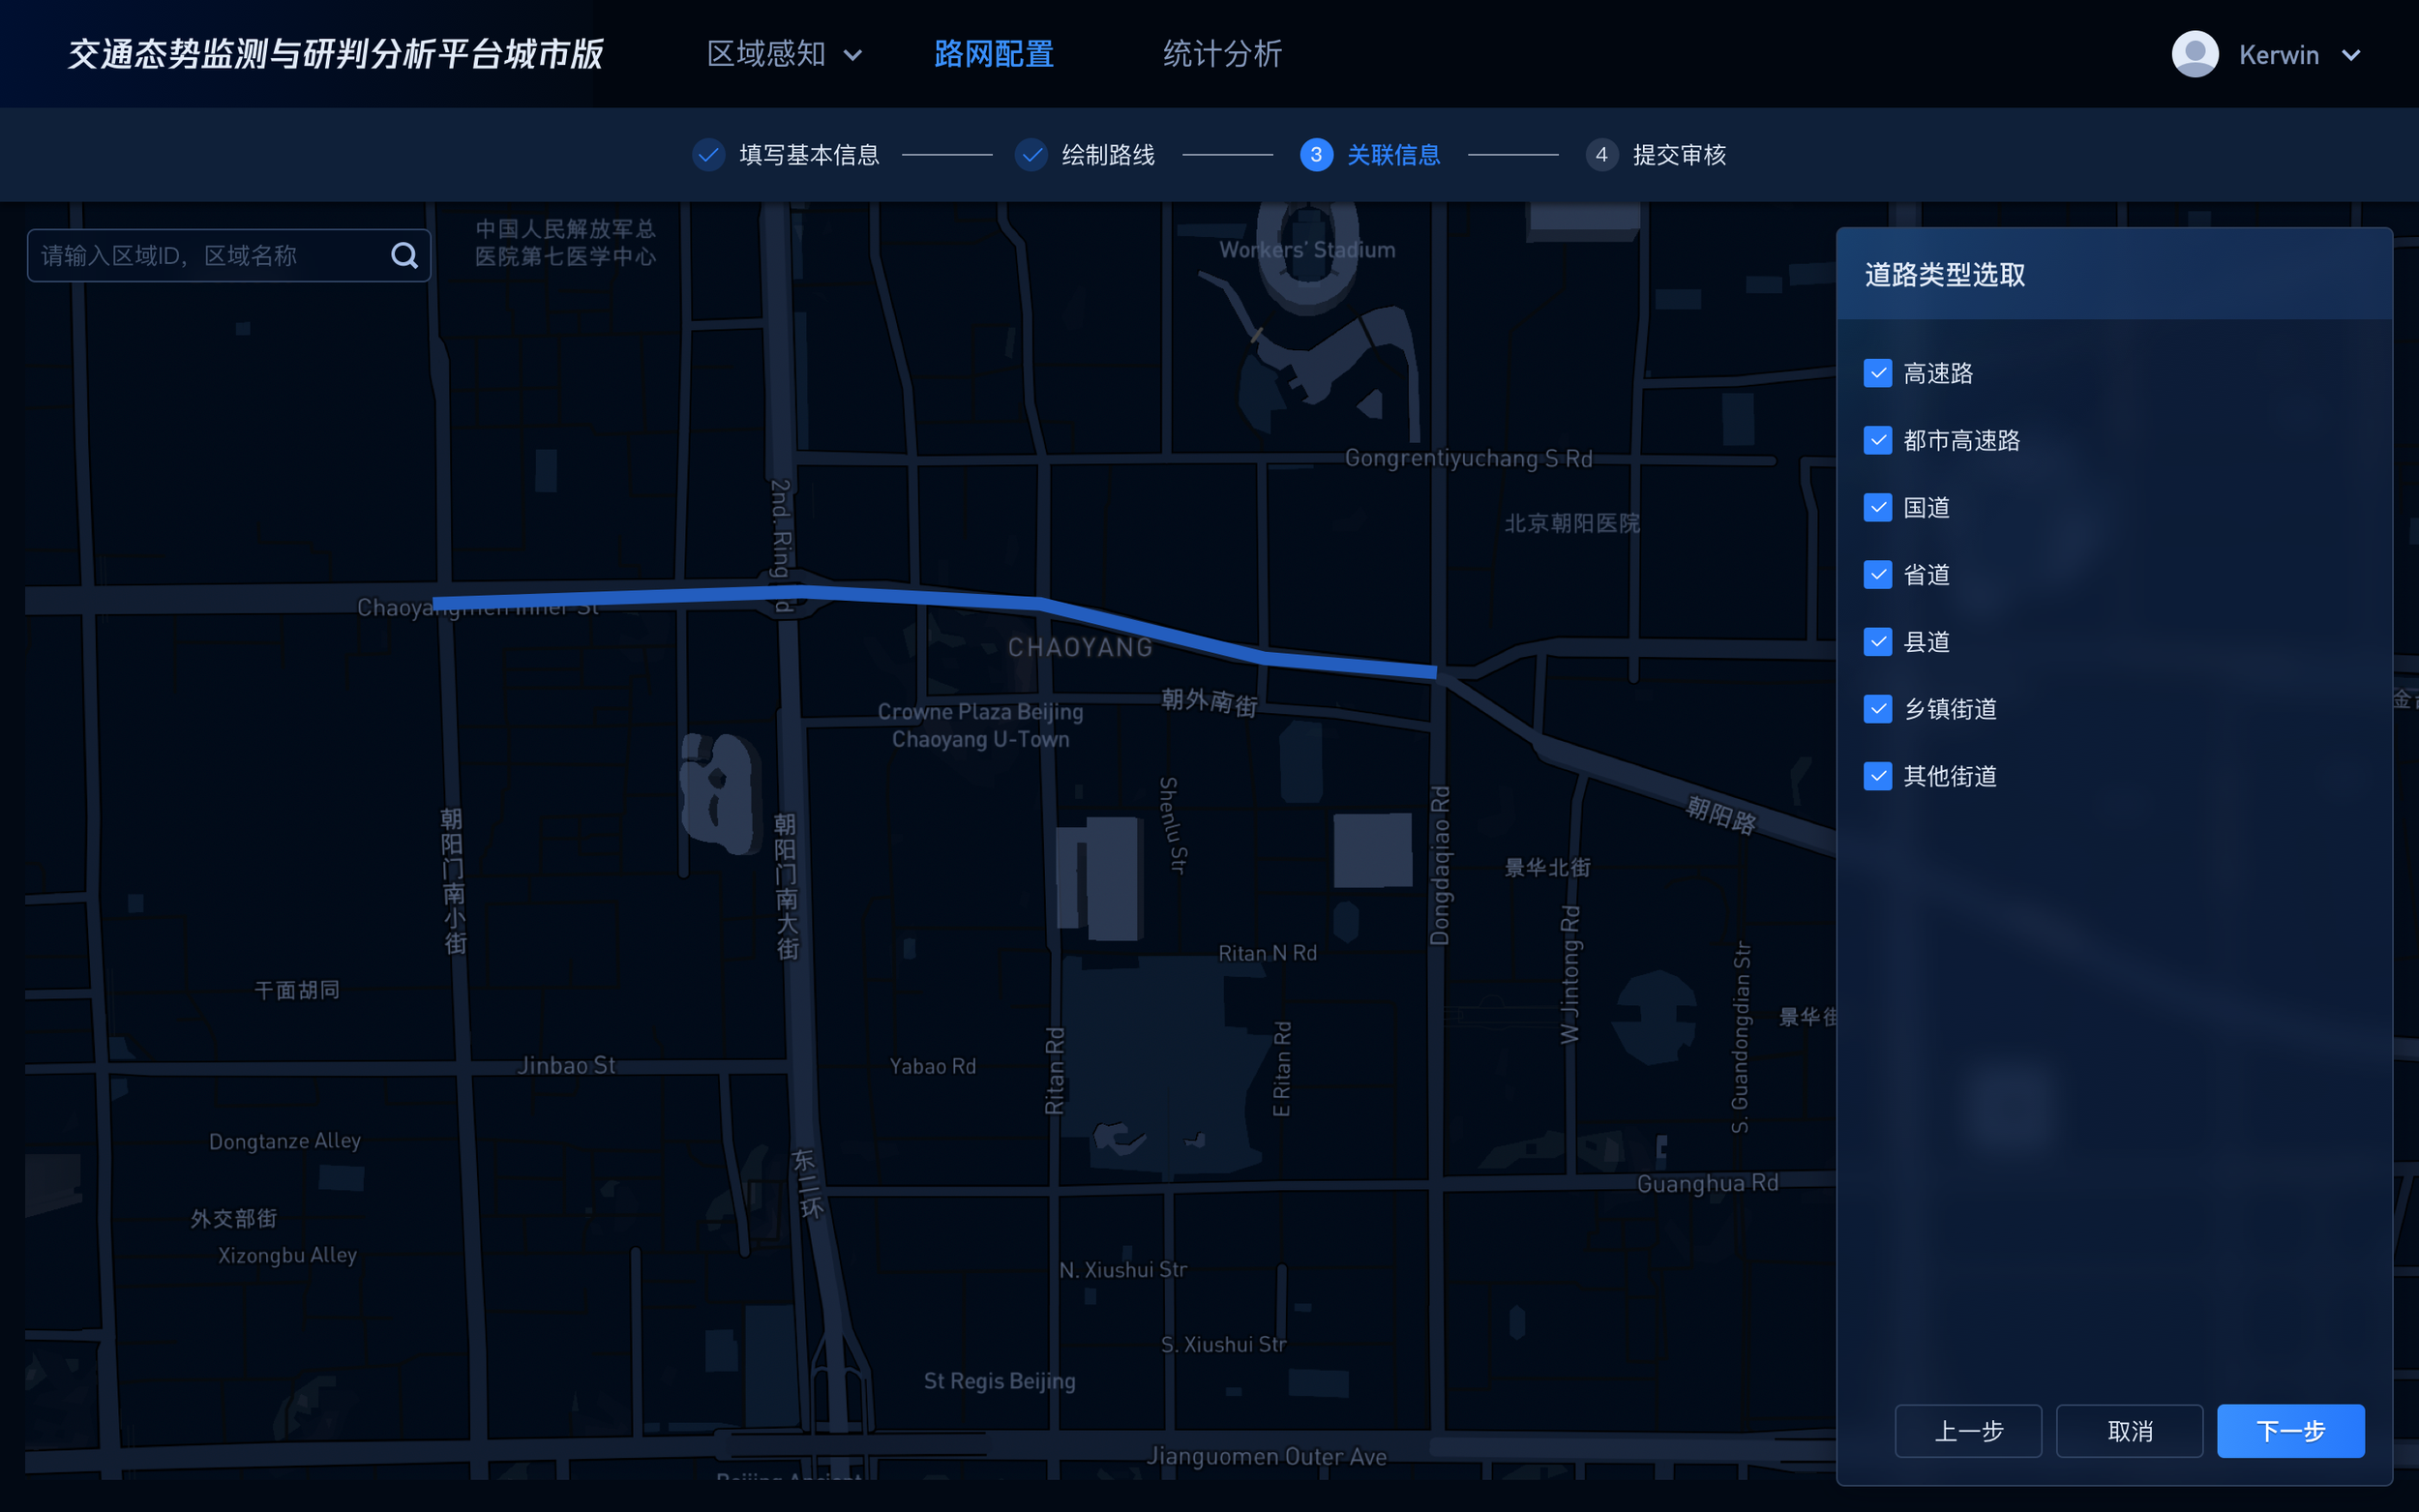
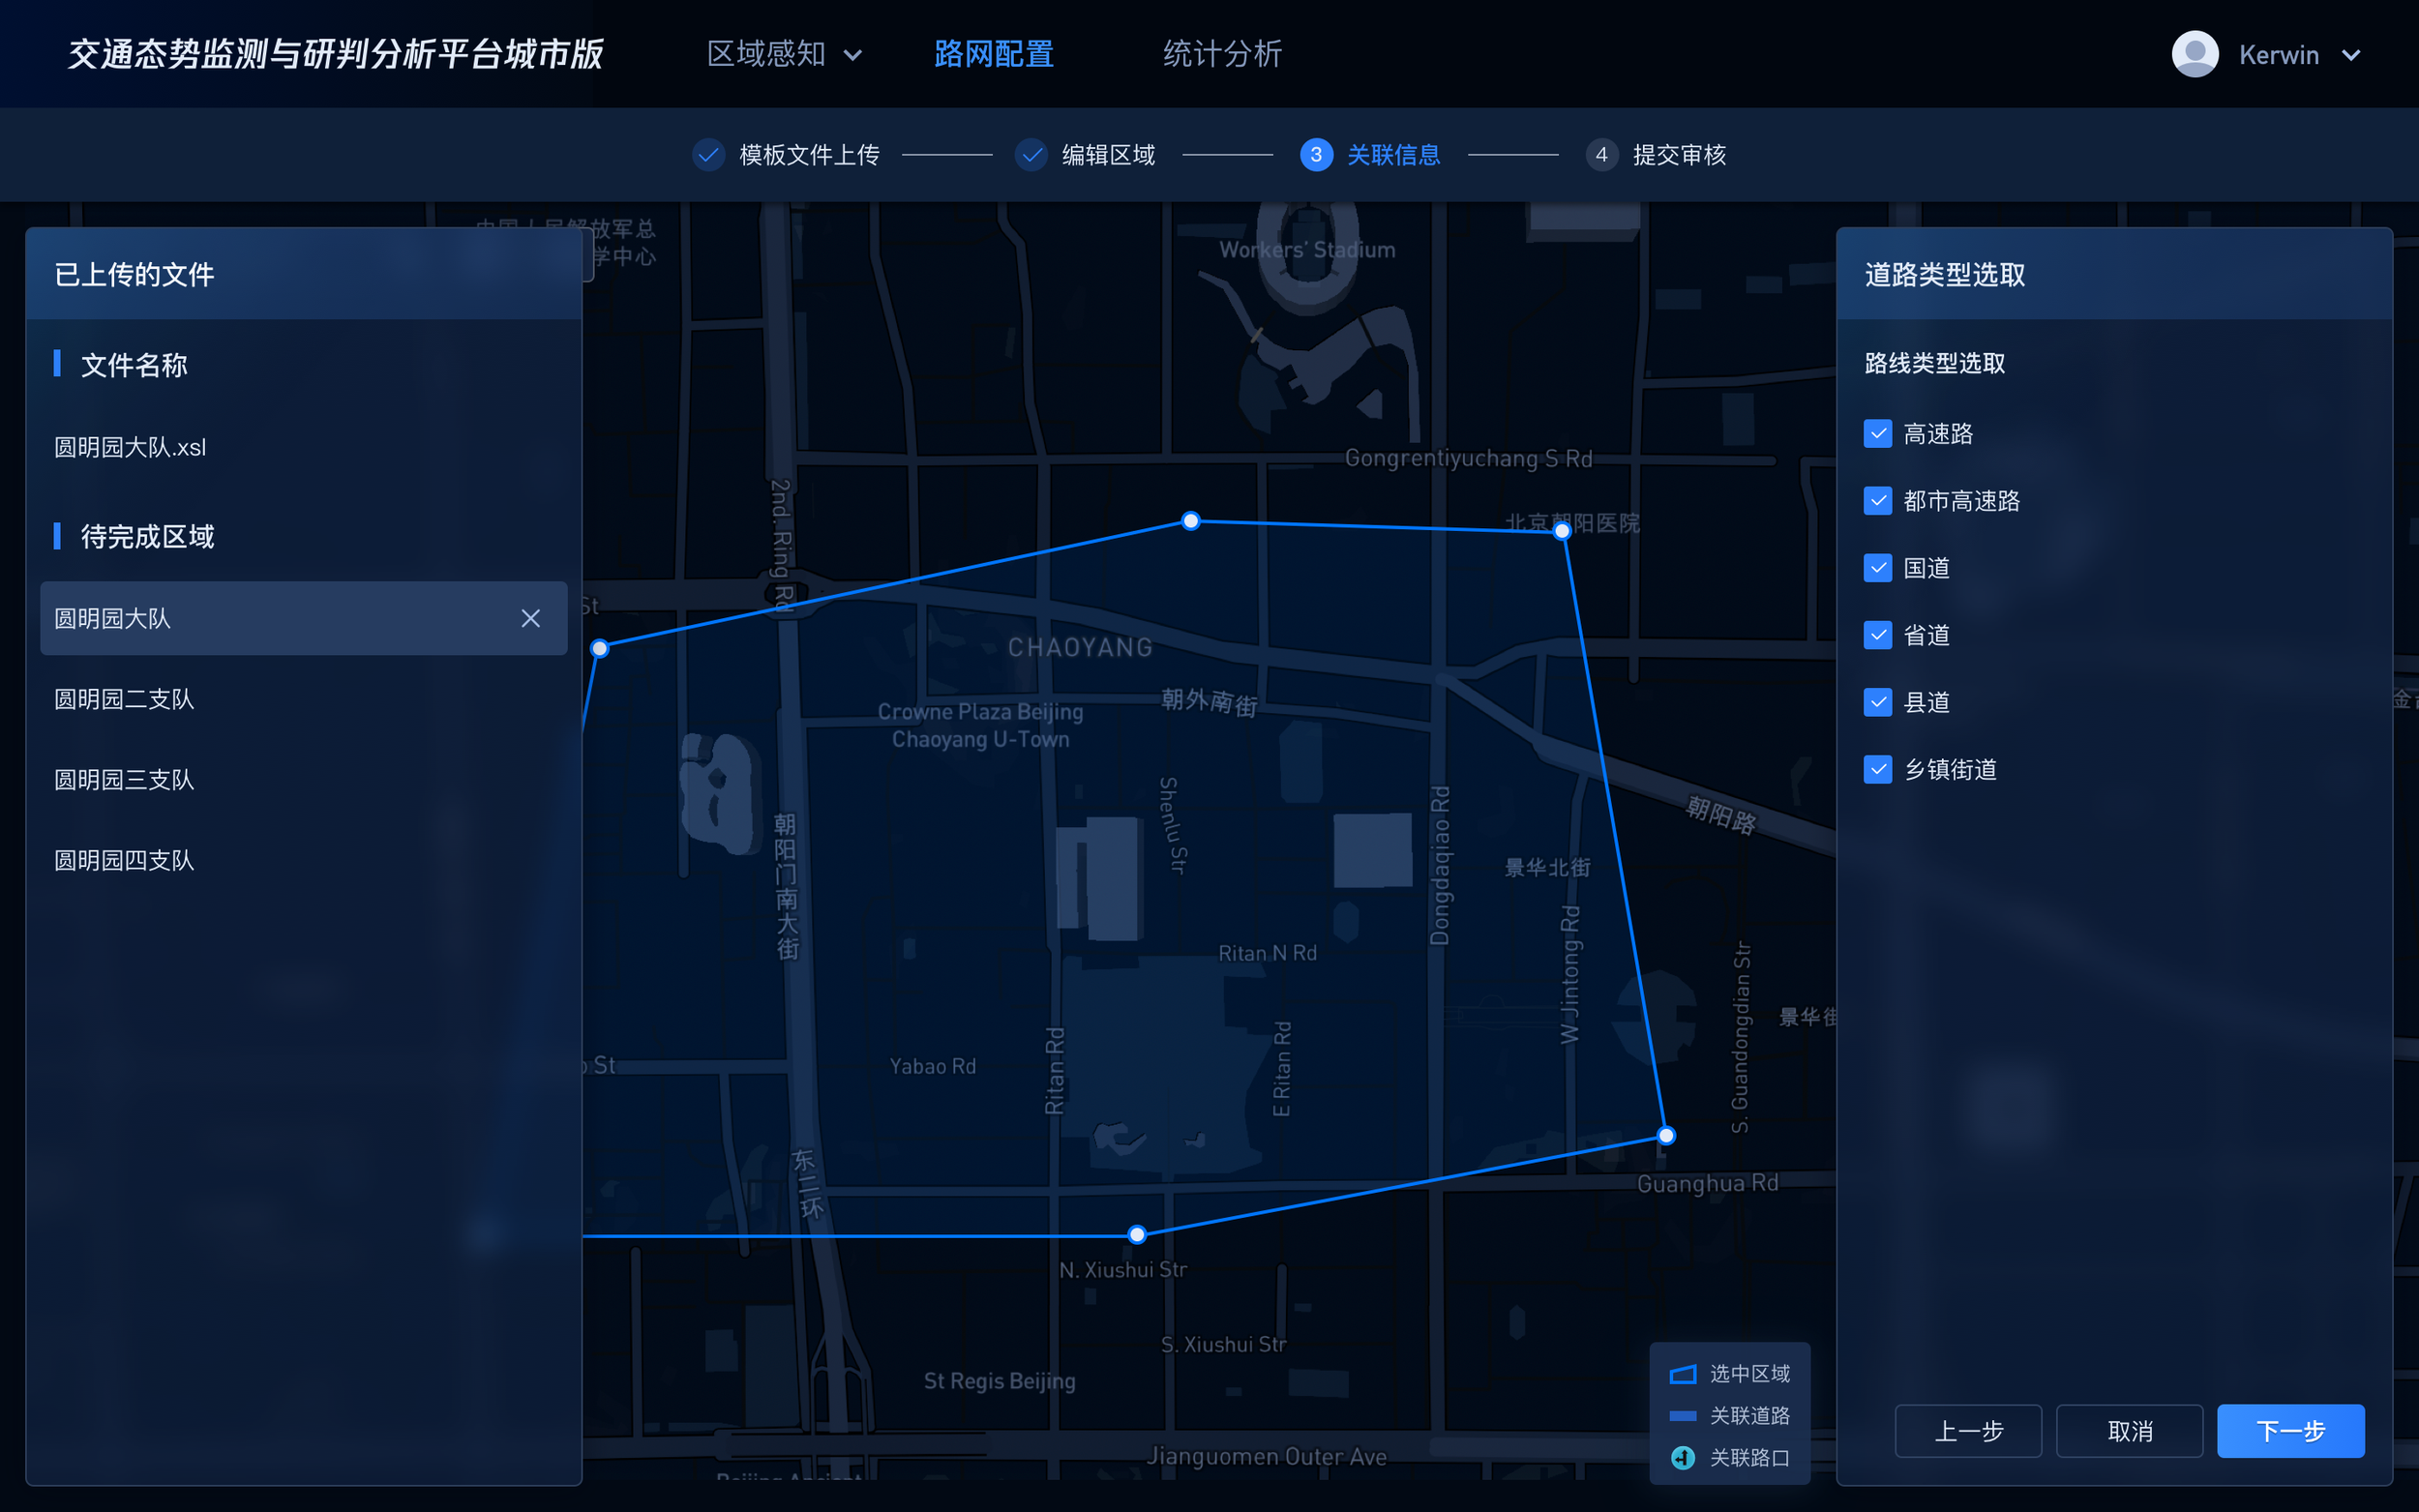
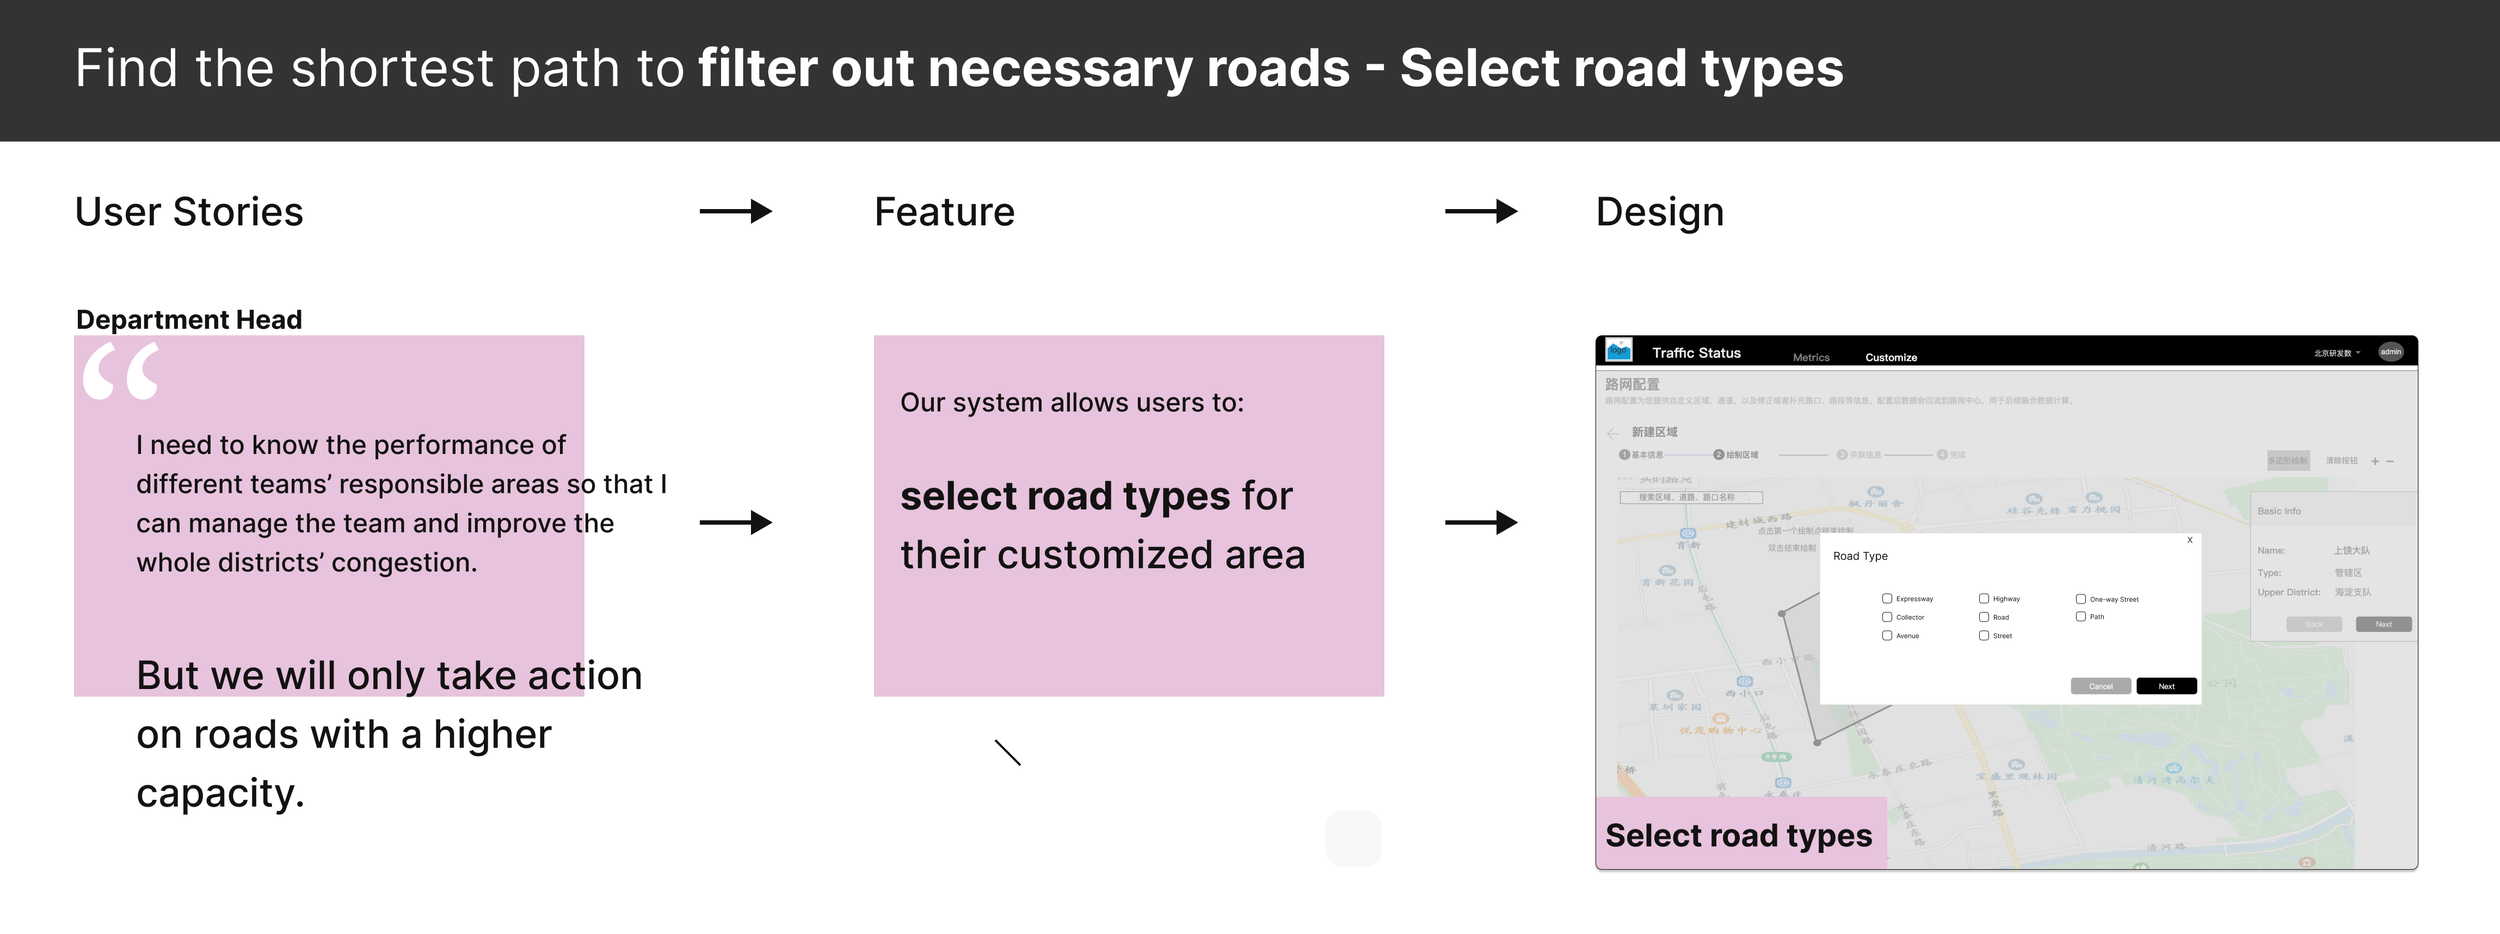
Further Customization:
Filter by type
Select the road type that will be included
Rational: Clear and quick
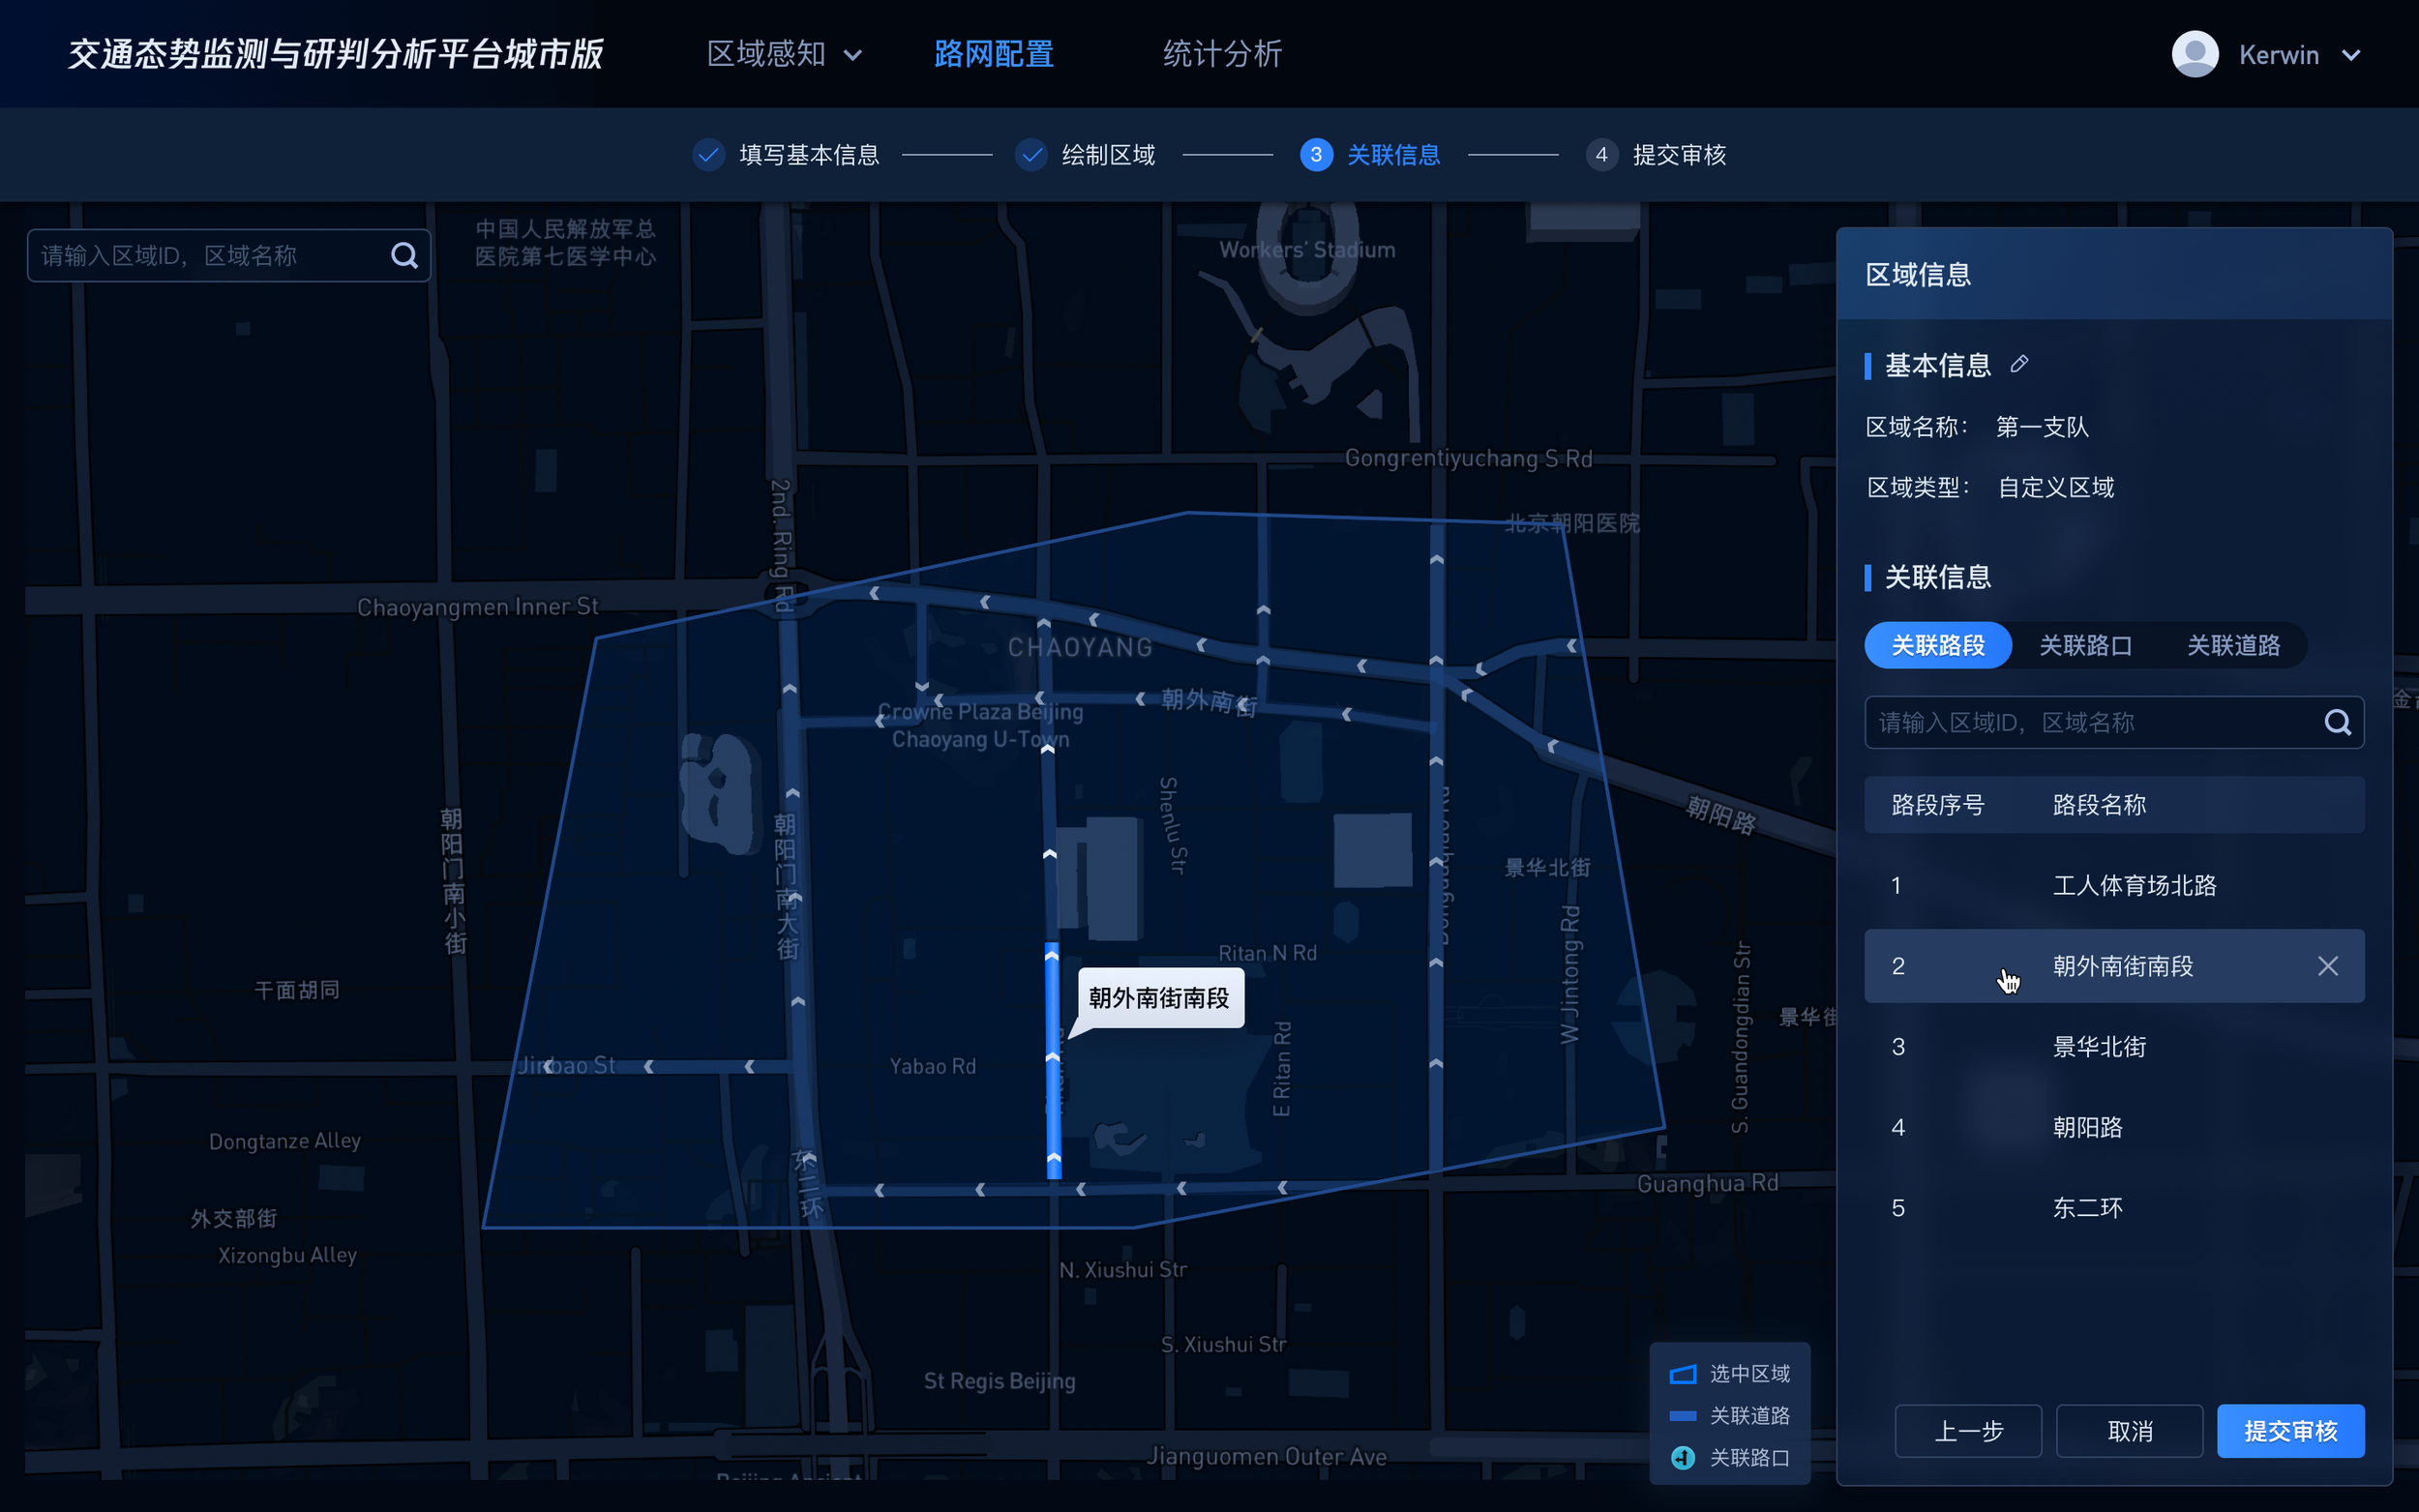
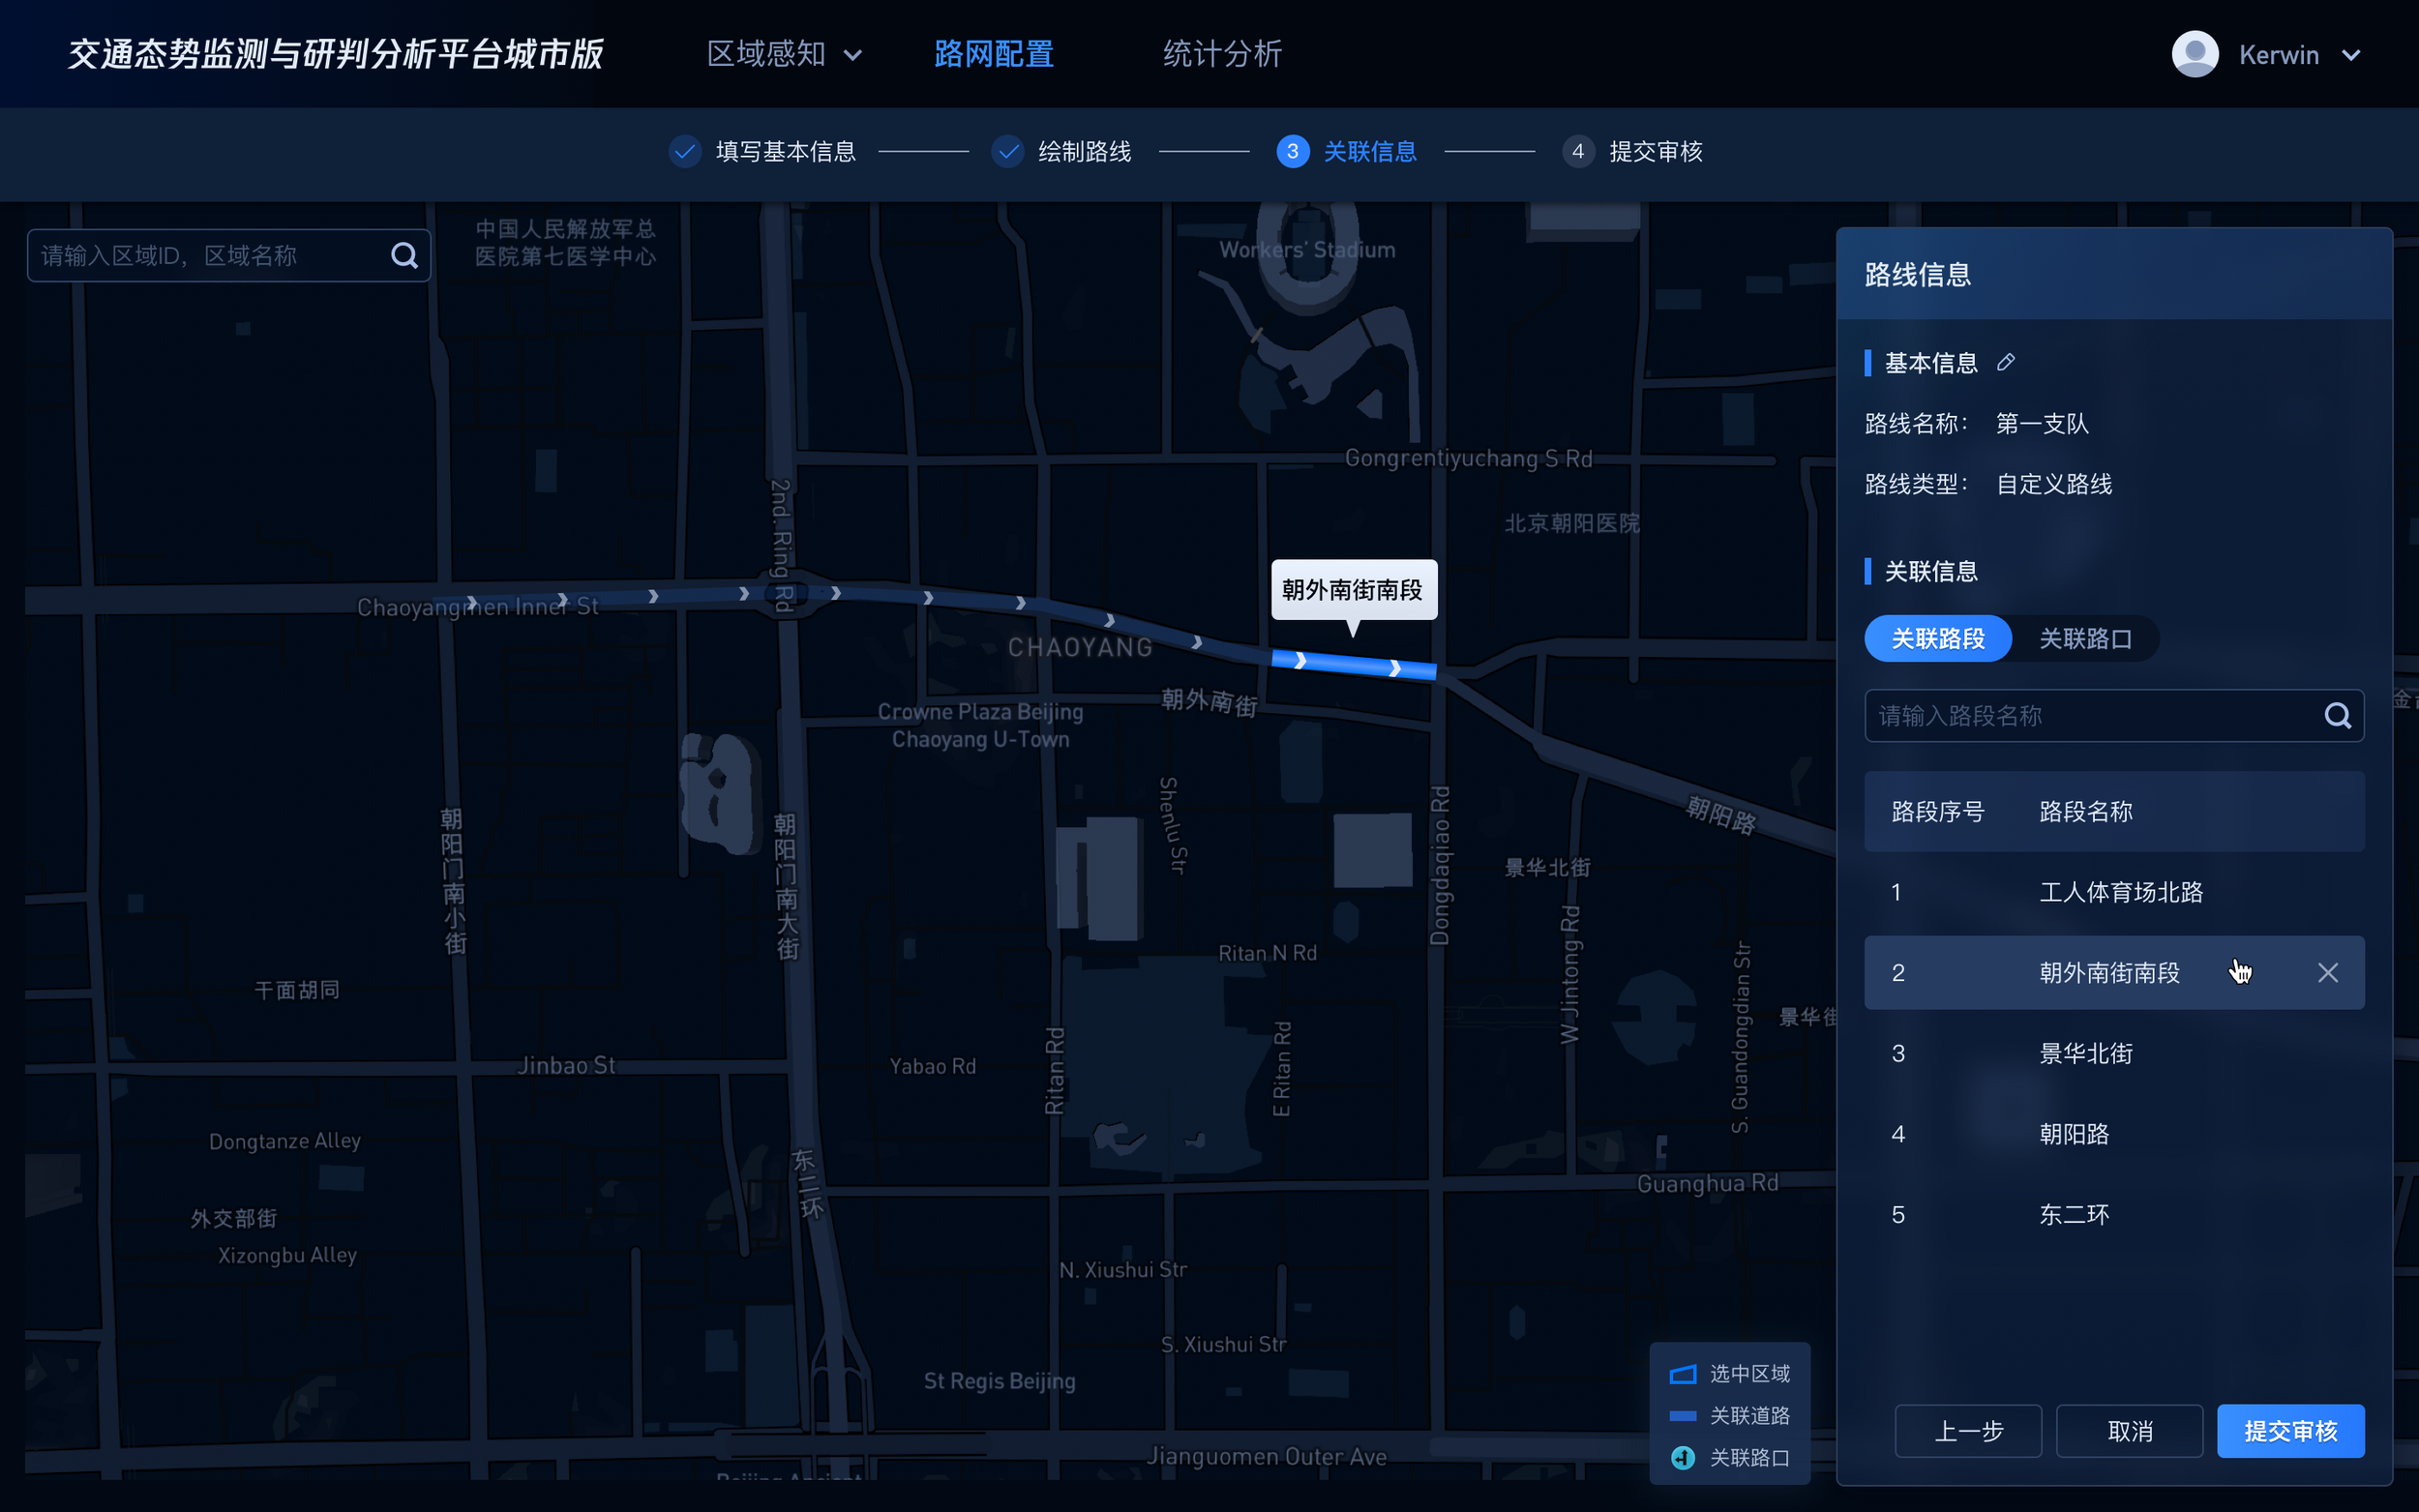
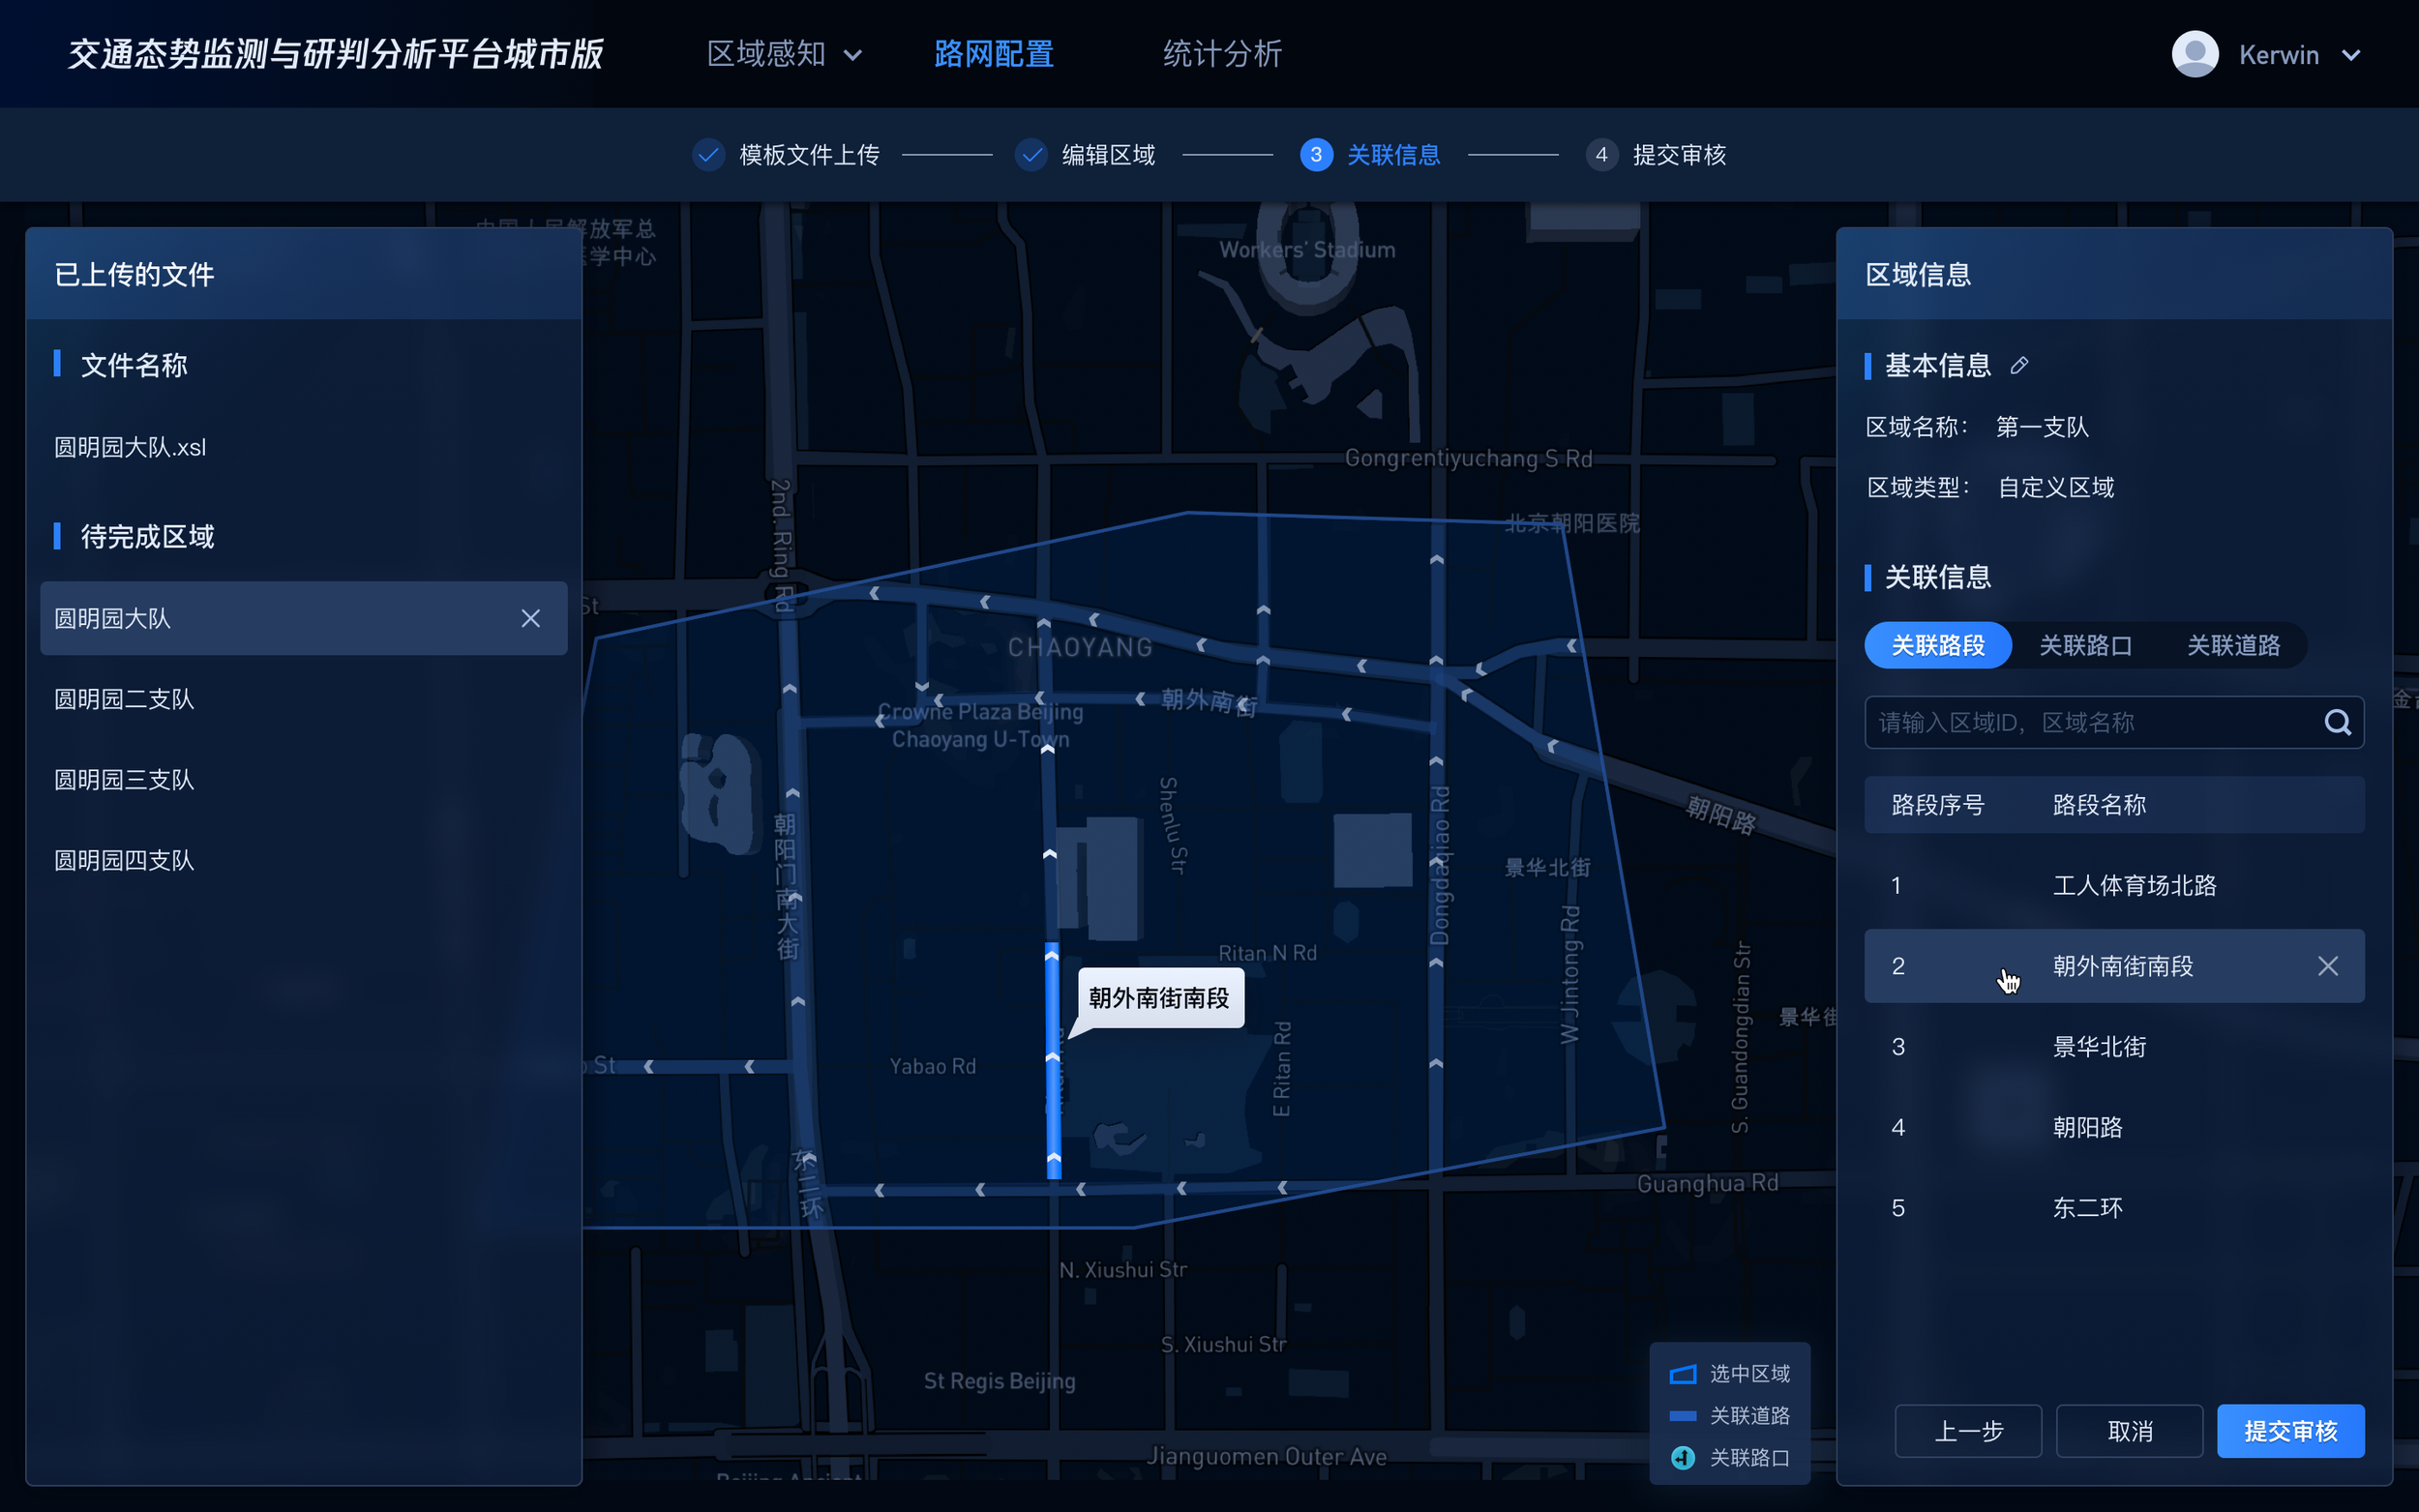
Precise Customization:
Delete the unwanted.
Let users easily delete roads/sections that should not be included when calculating the metrics via an interactive map.
Rational: Flexible and intuitive
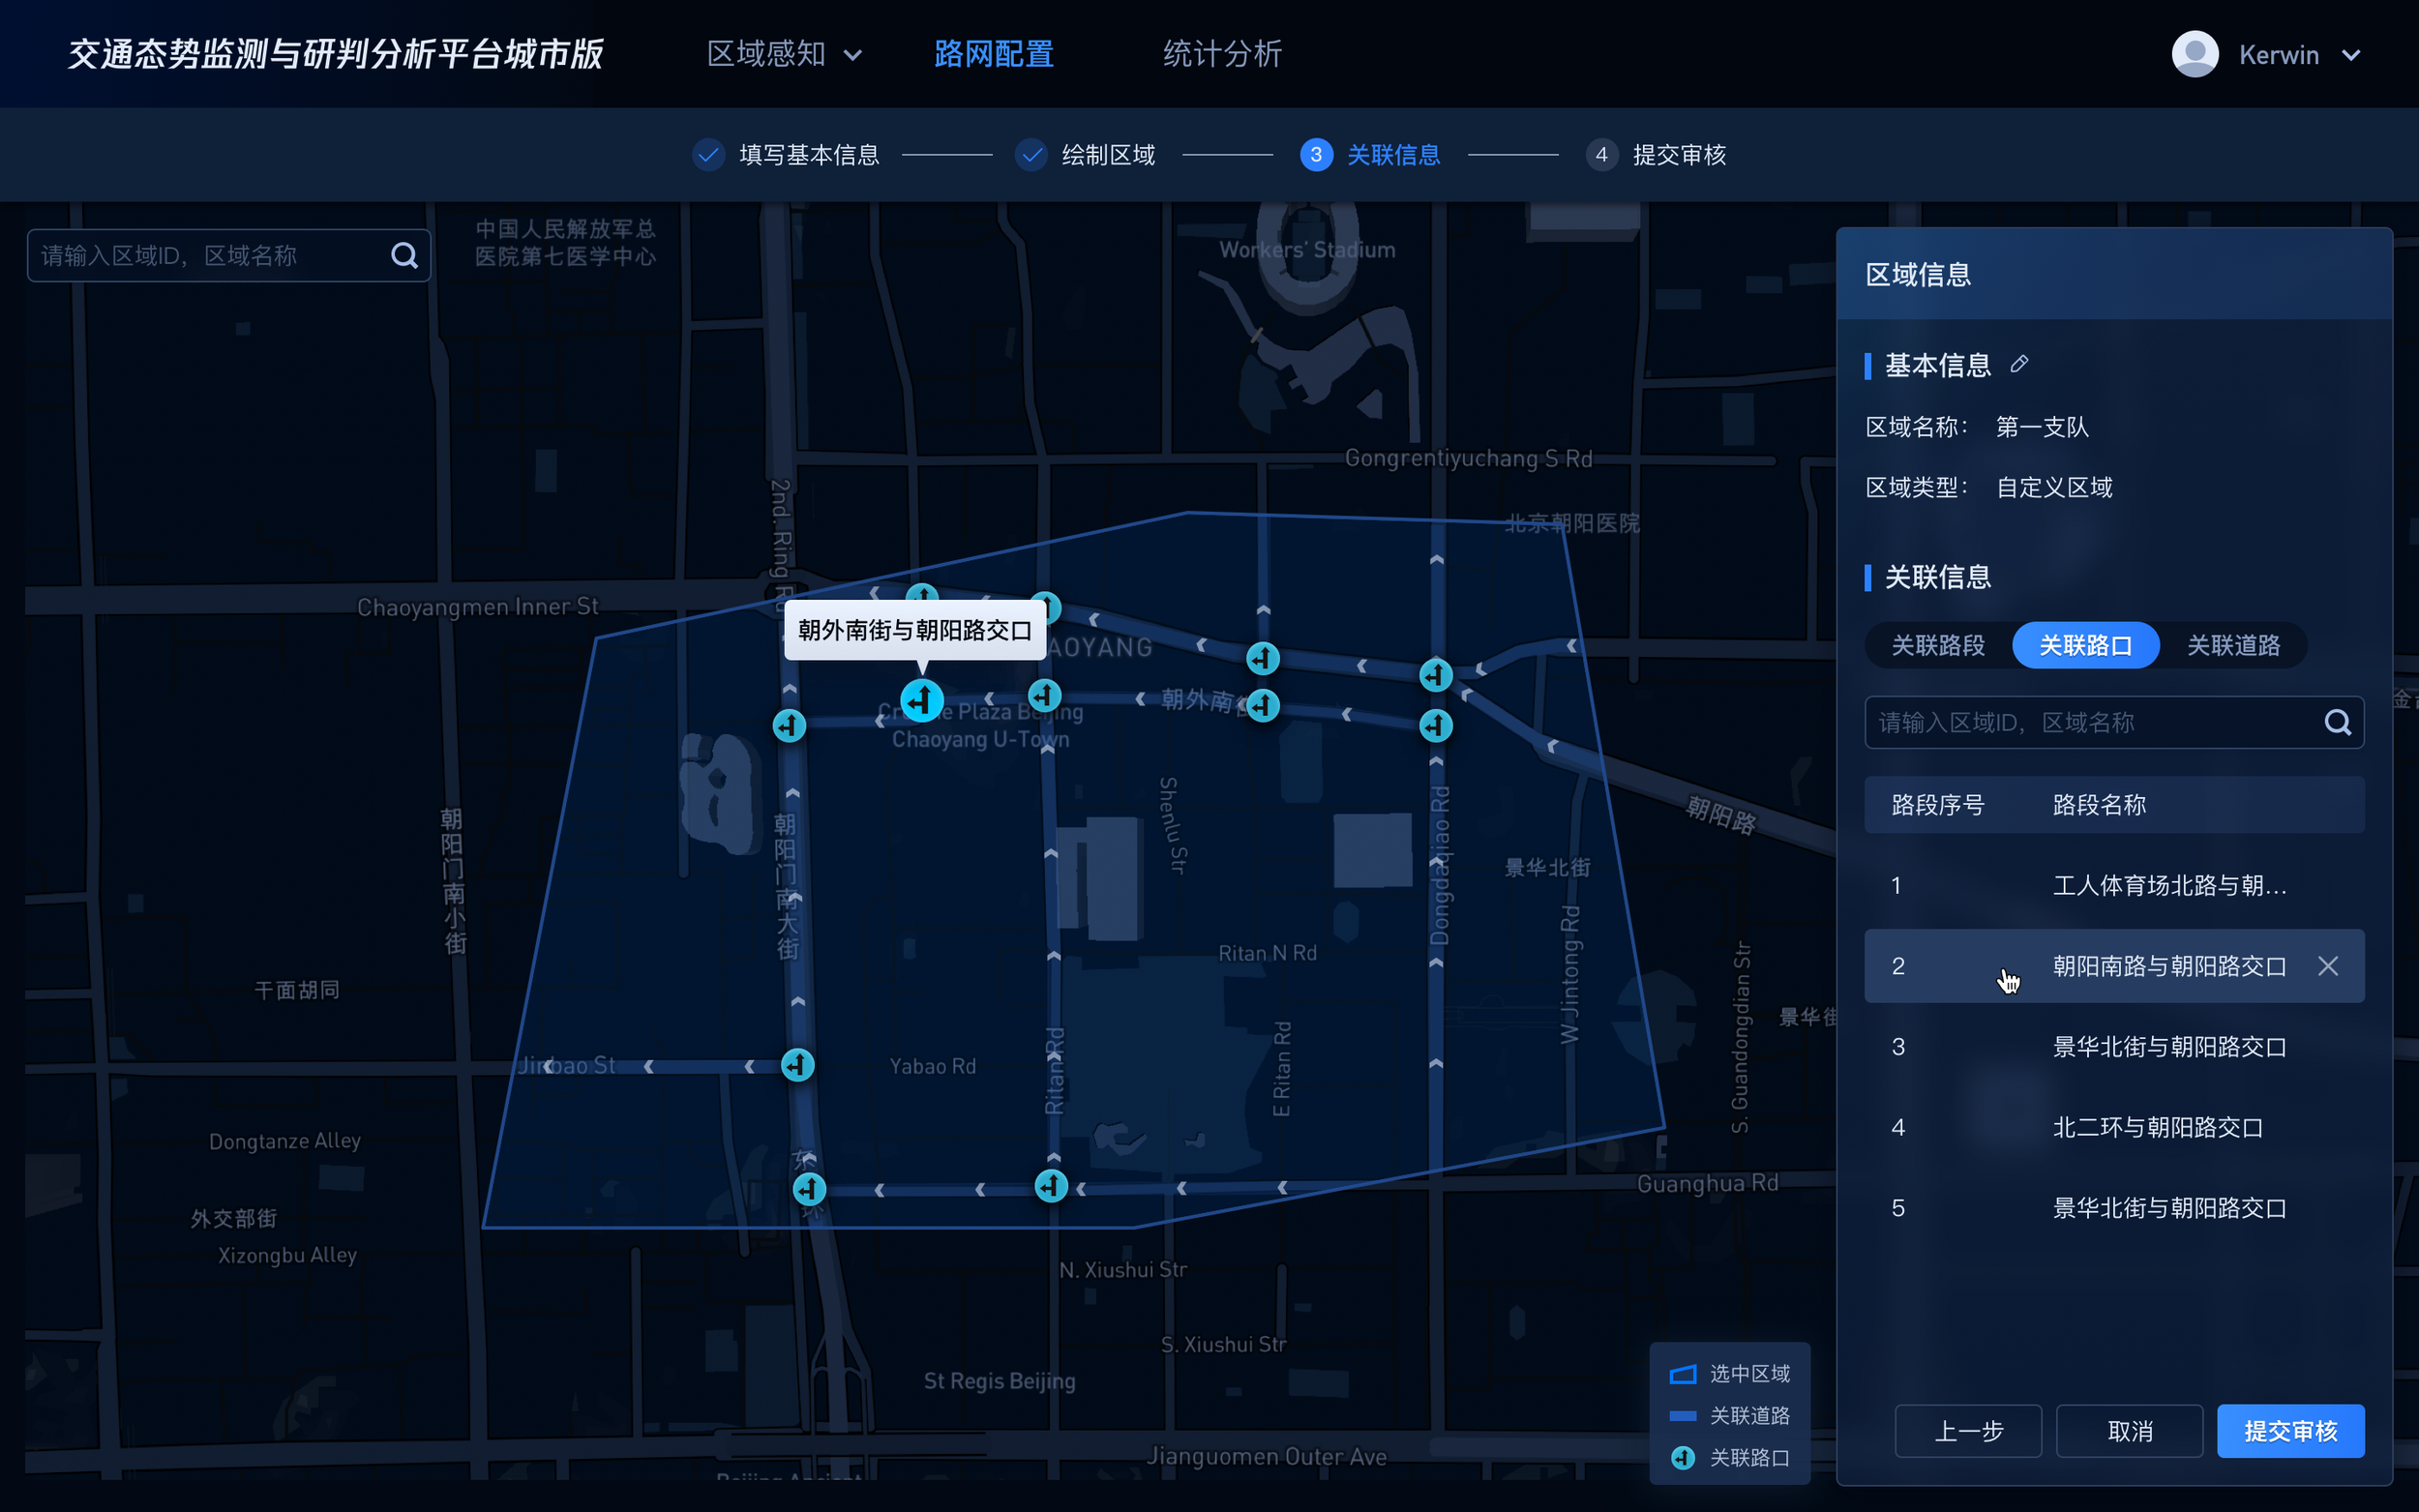
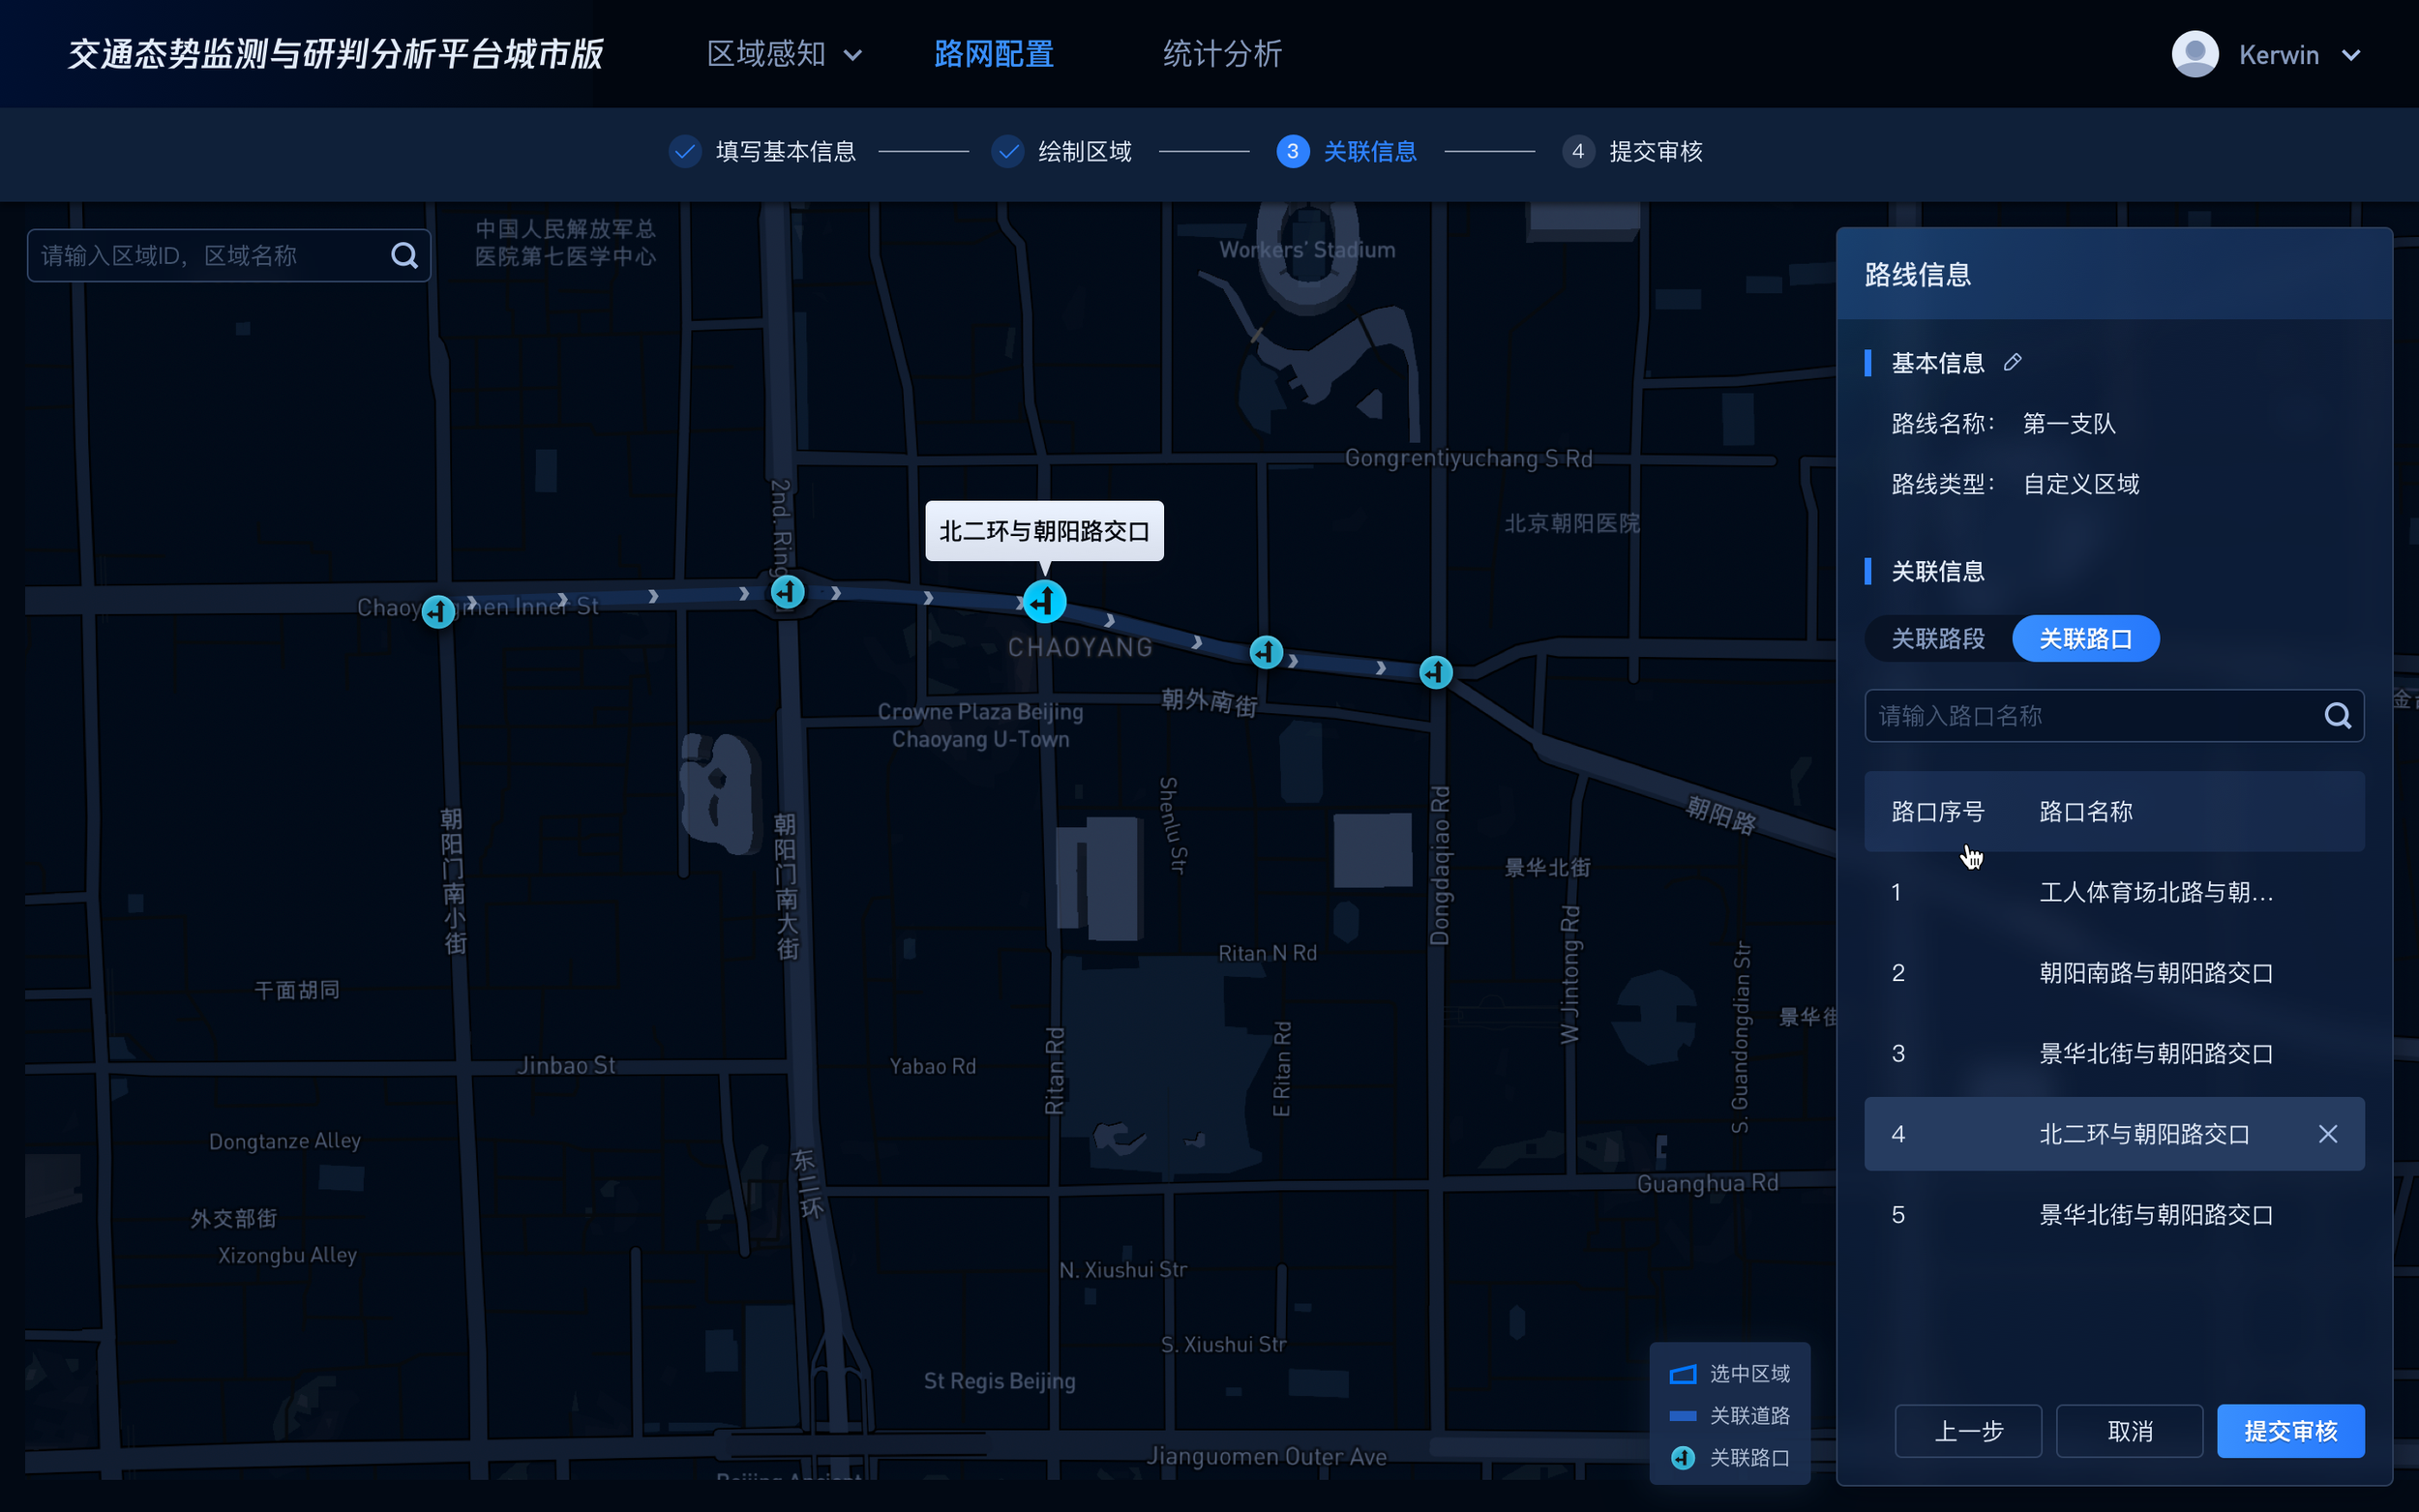
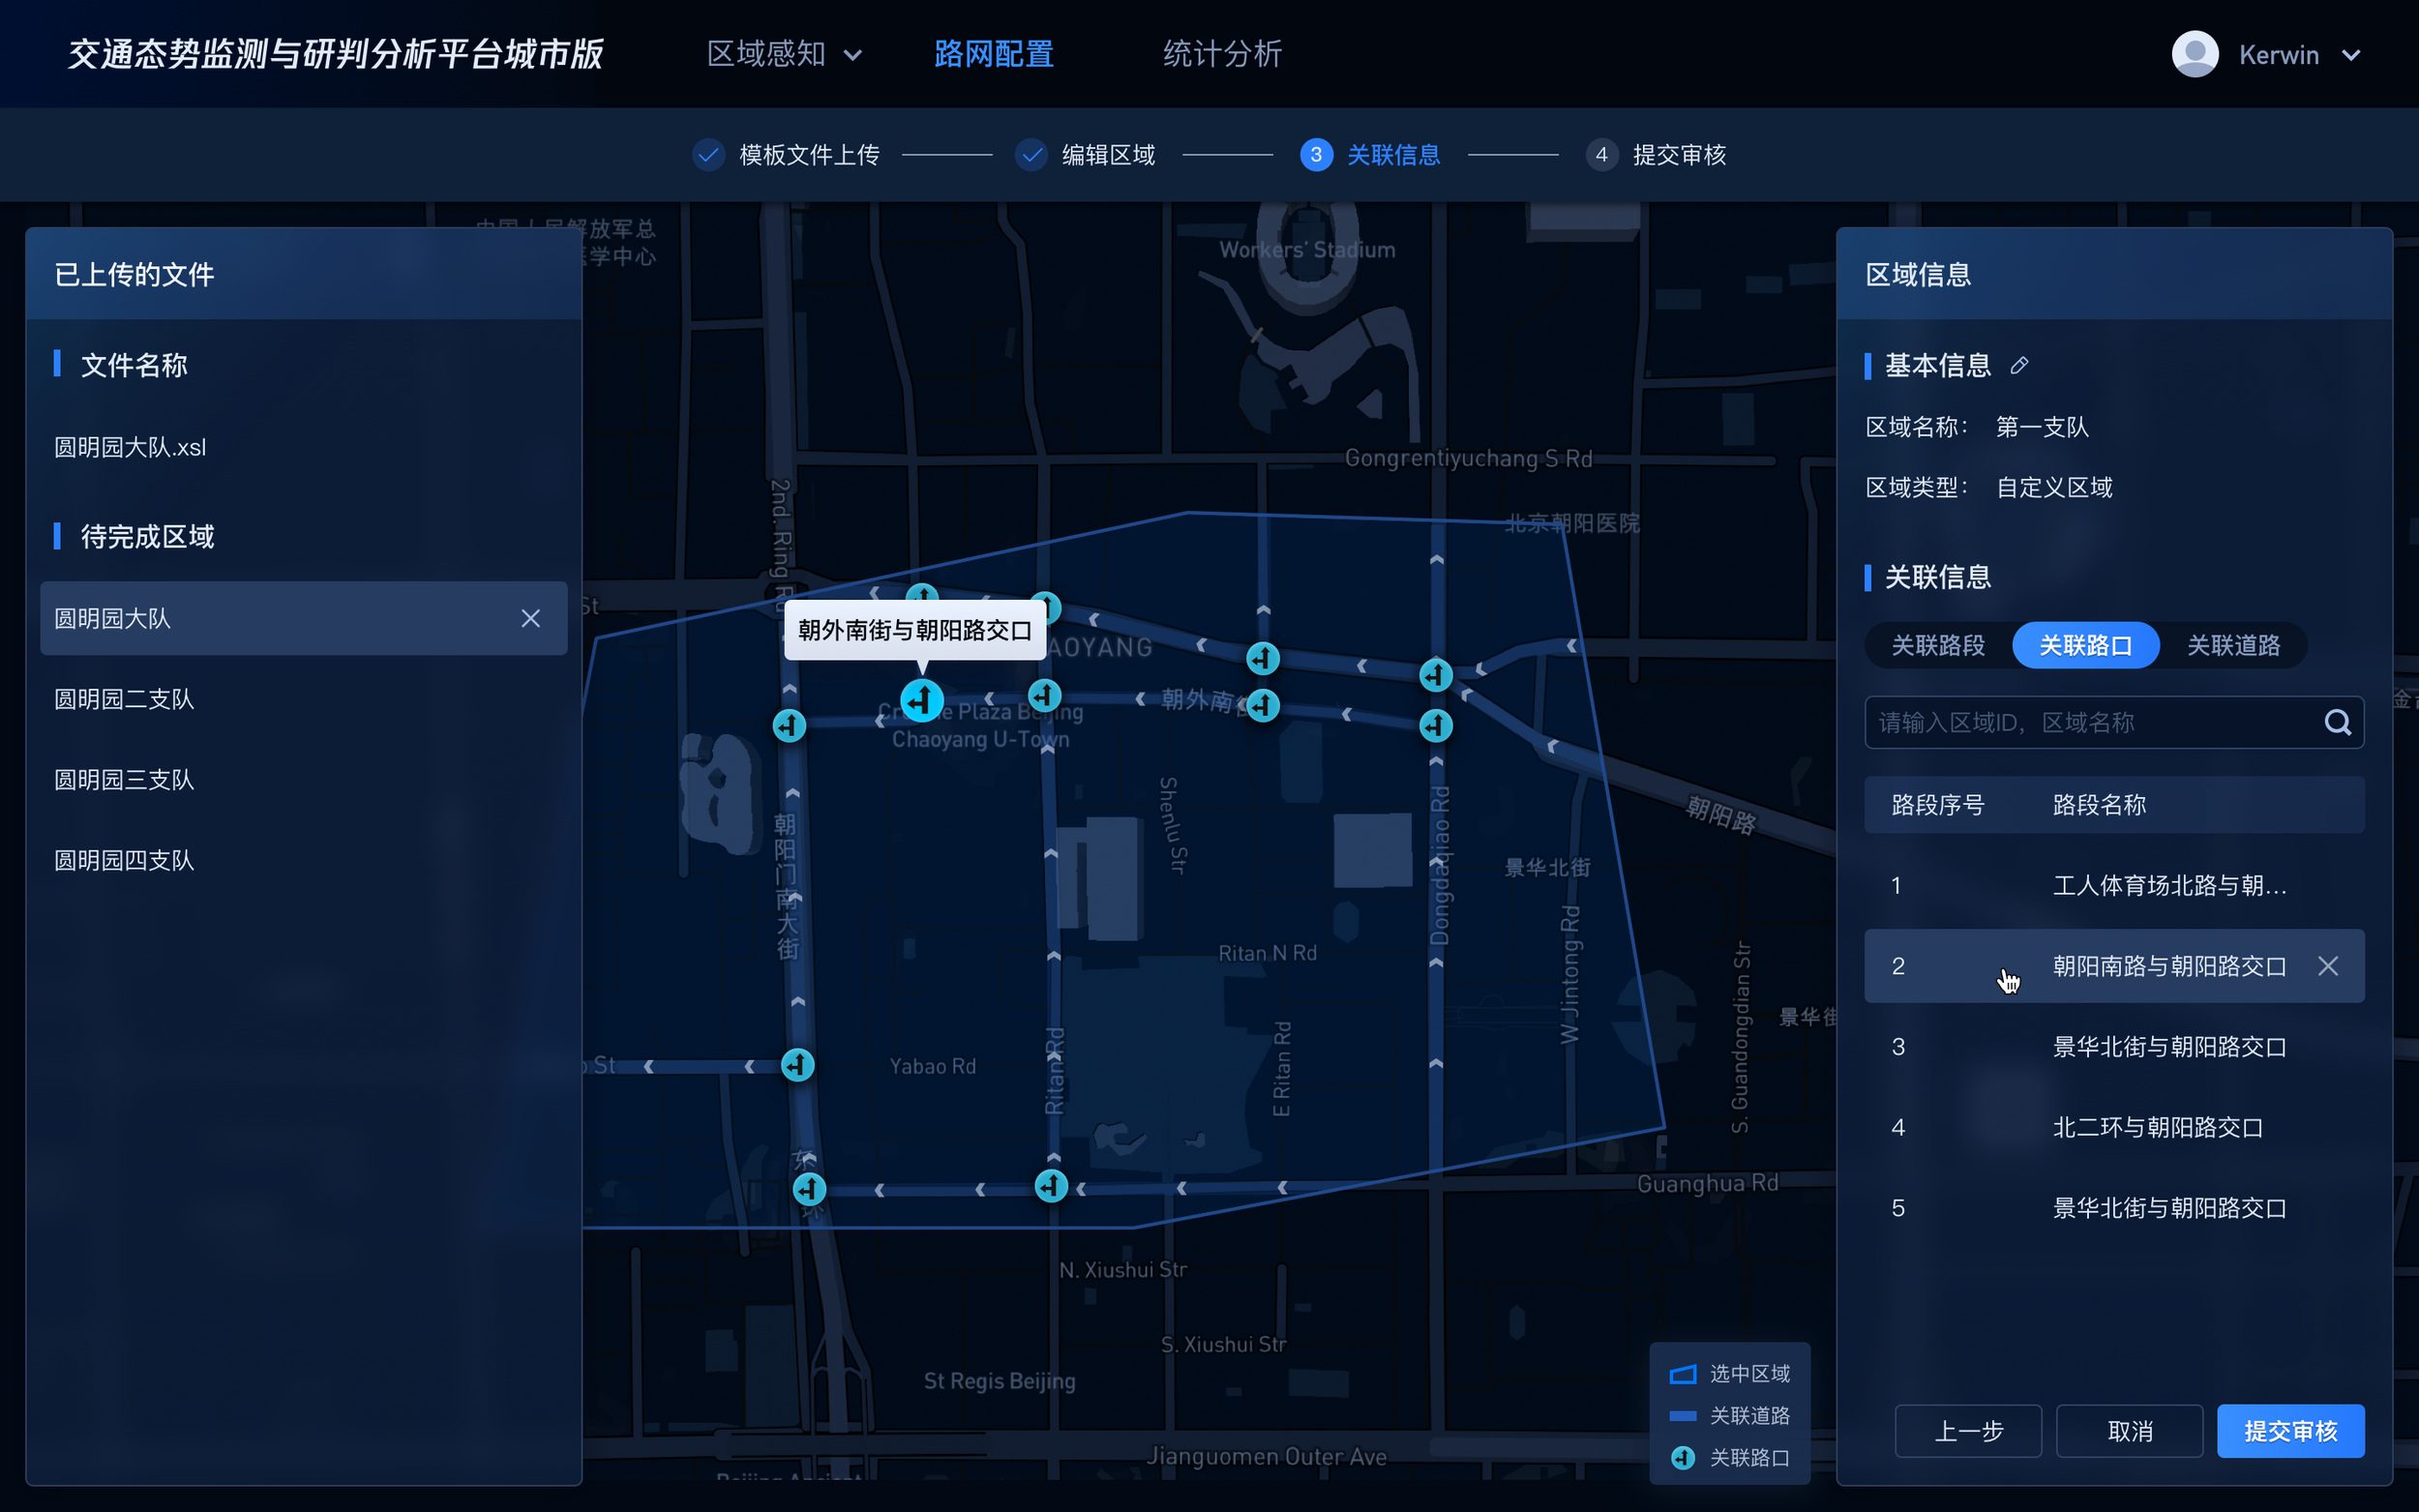
Precise Customization:
Delete the unwanted
Let users easily delete crossings that should not be included when calculating the metrics via an interactive map.
Rational: Flexible and intuitive
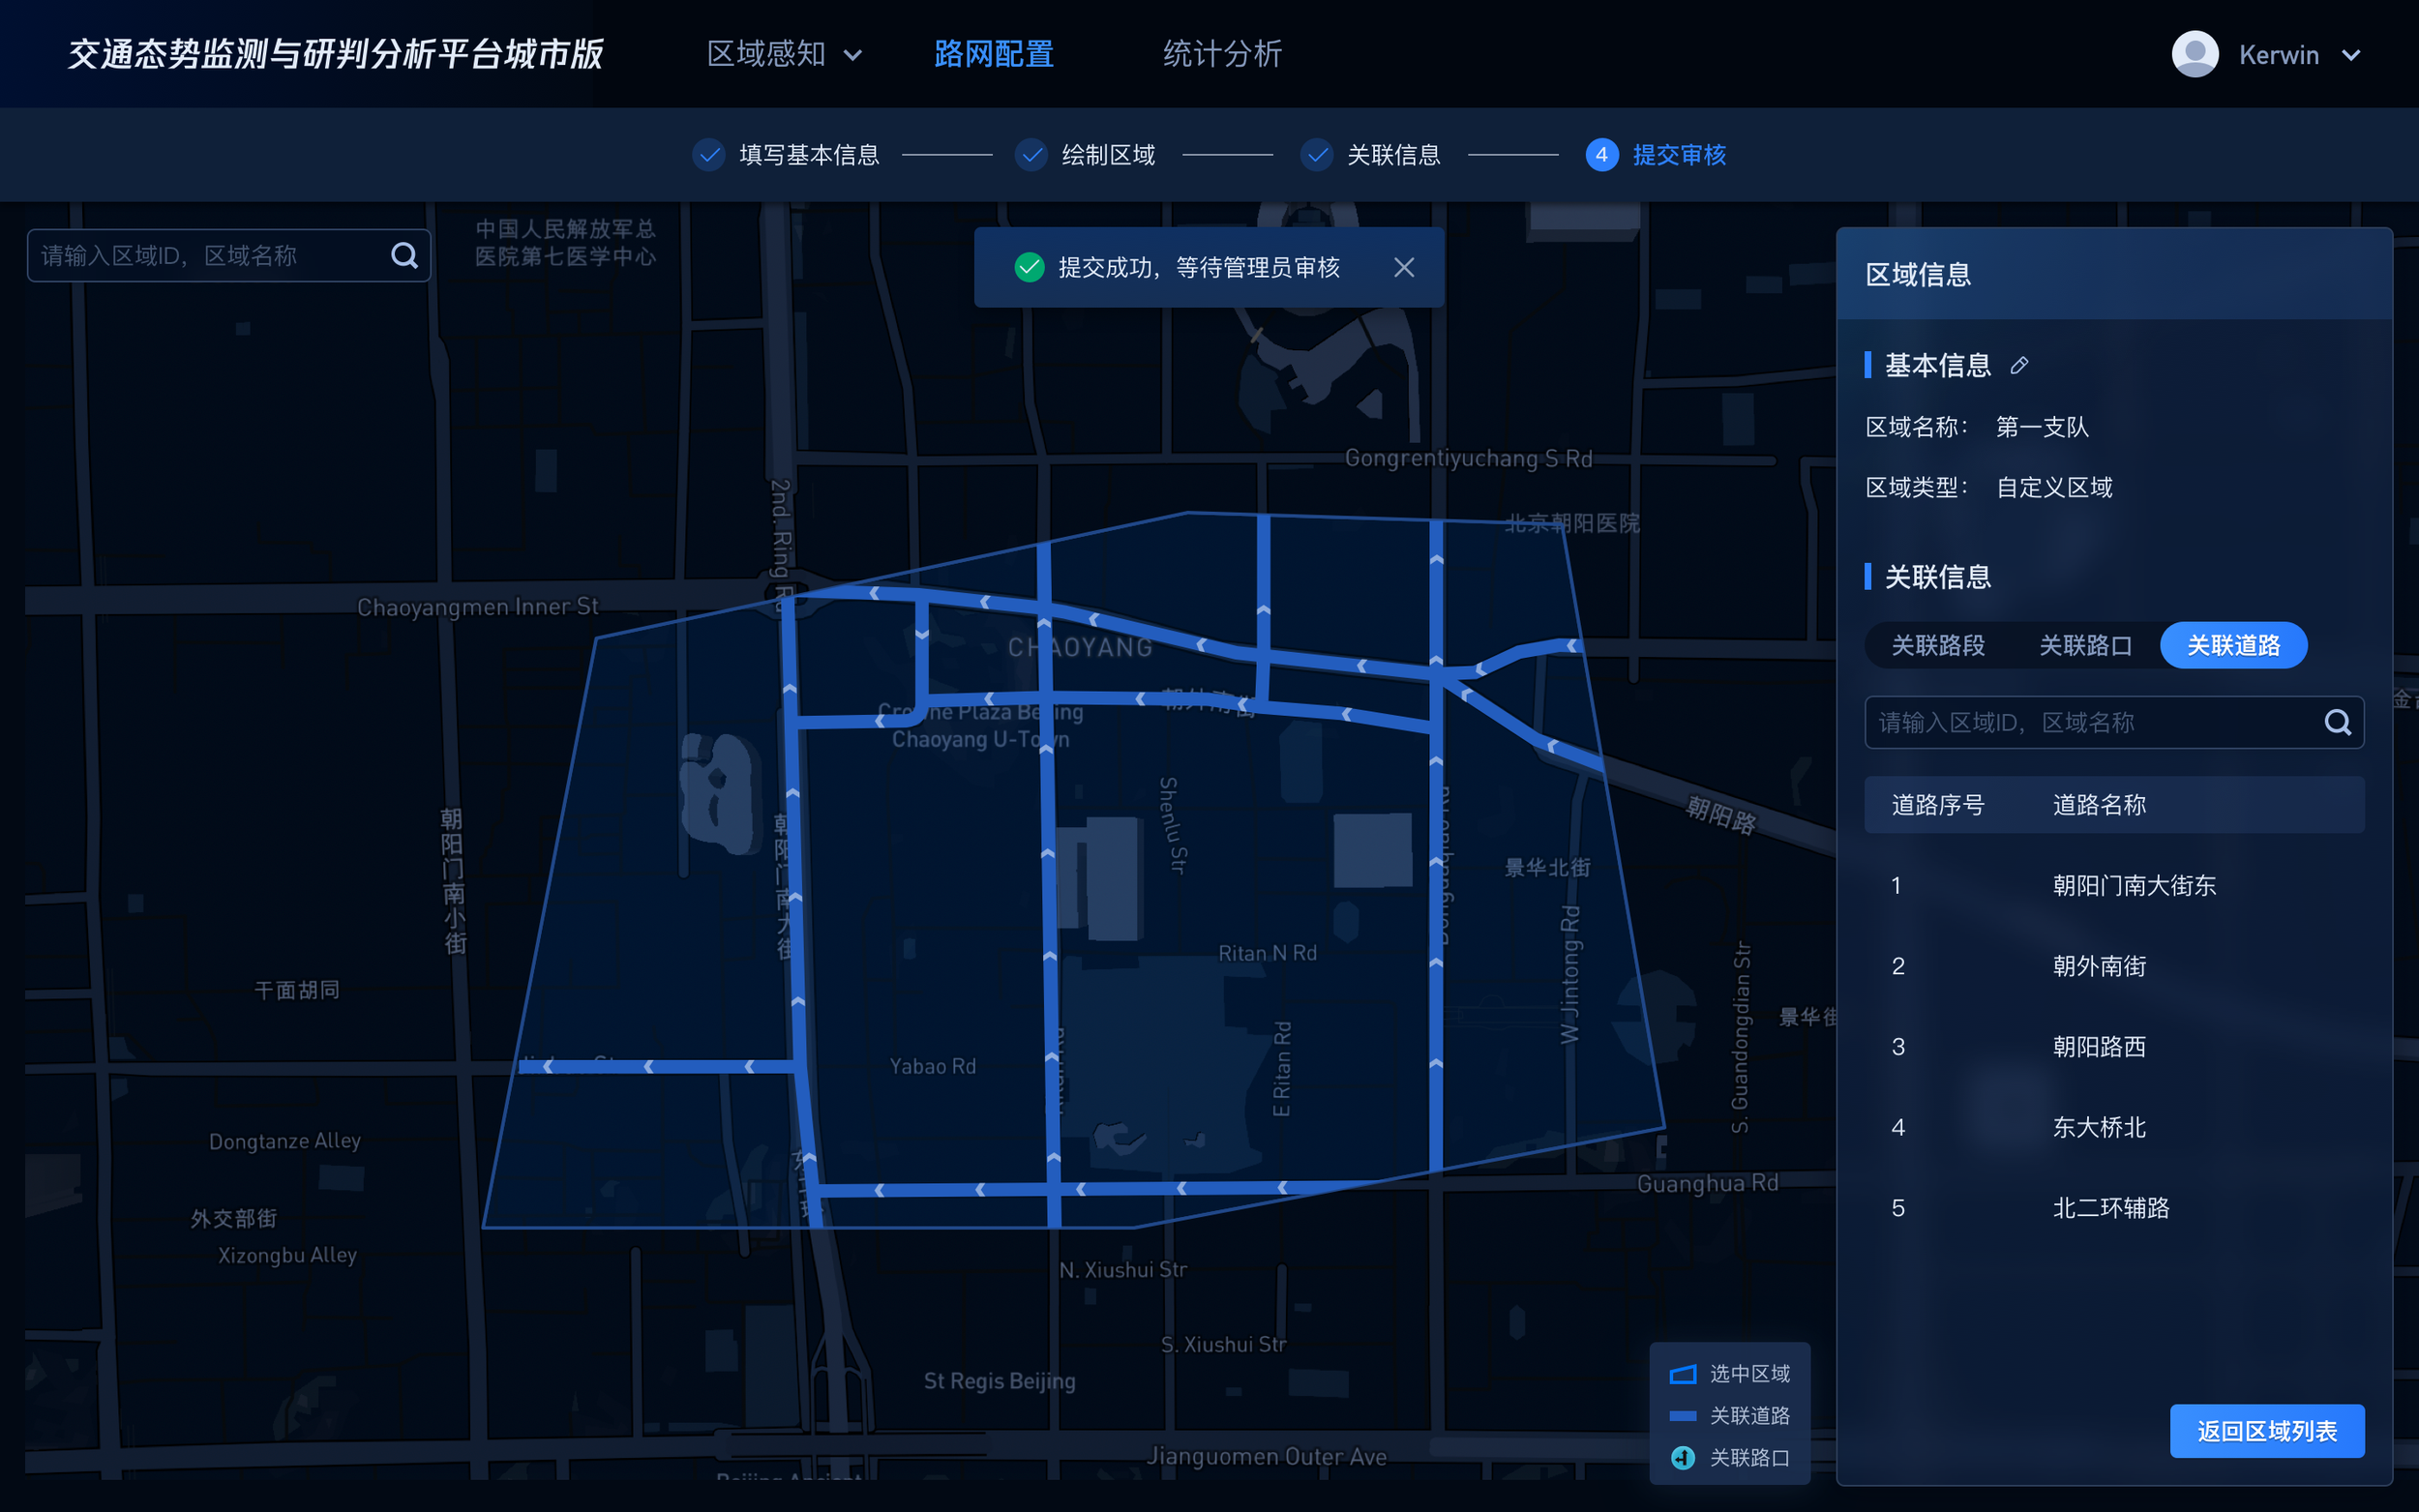
Show Customized Metrics
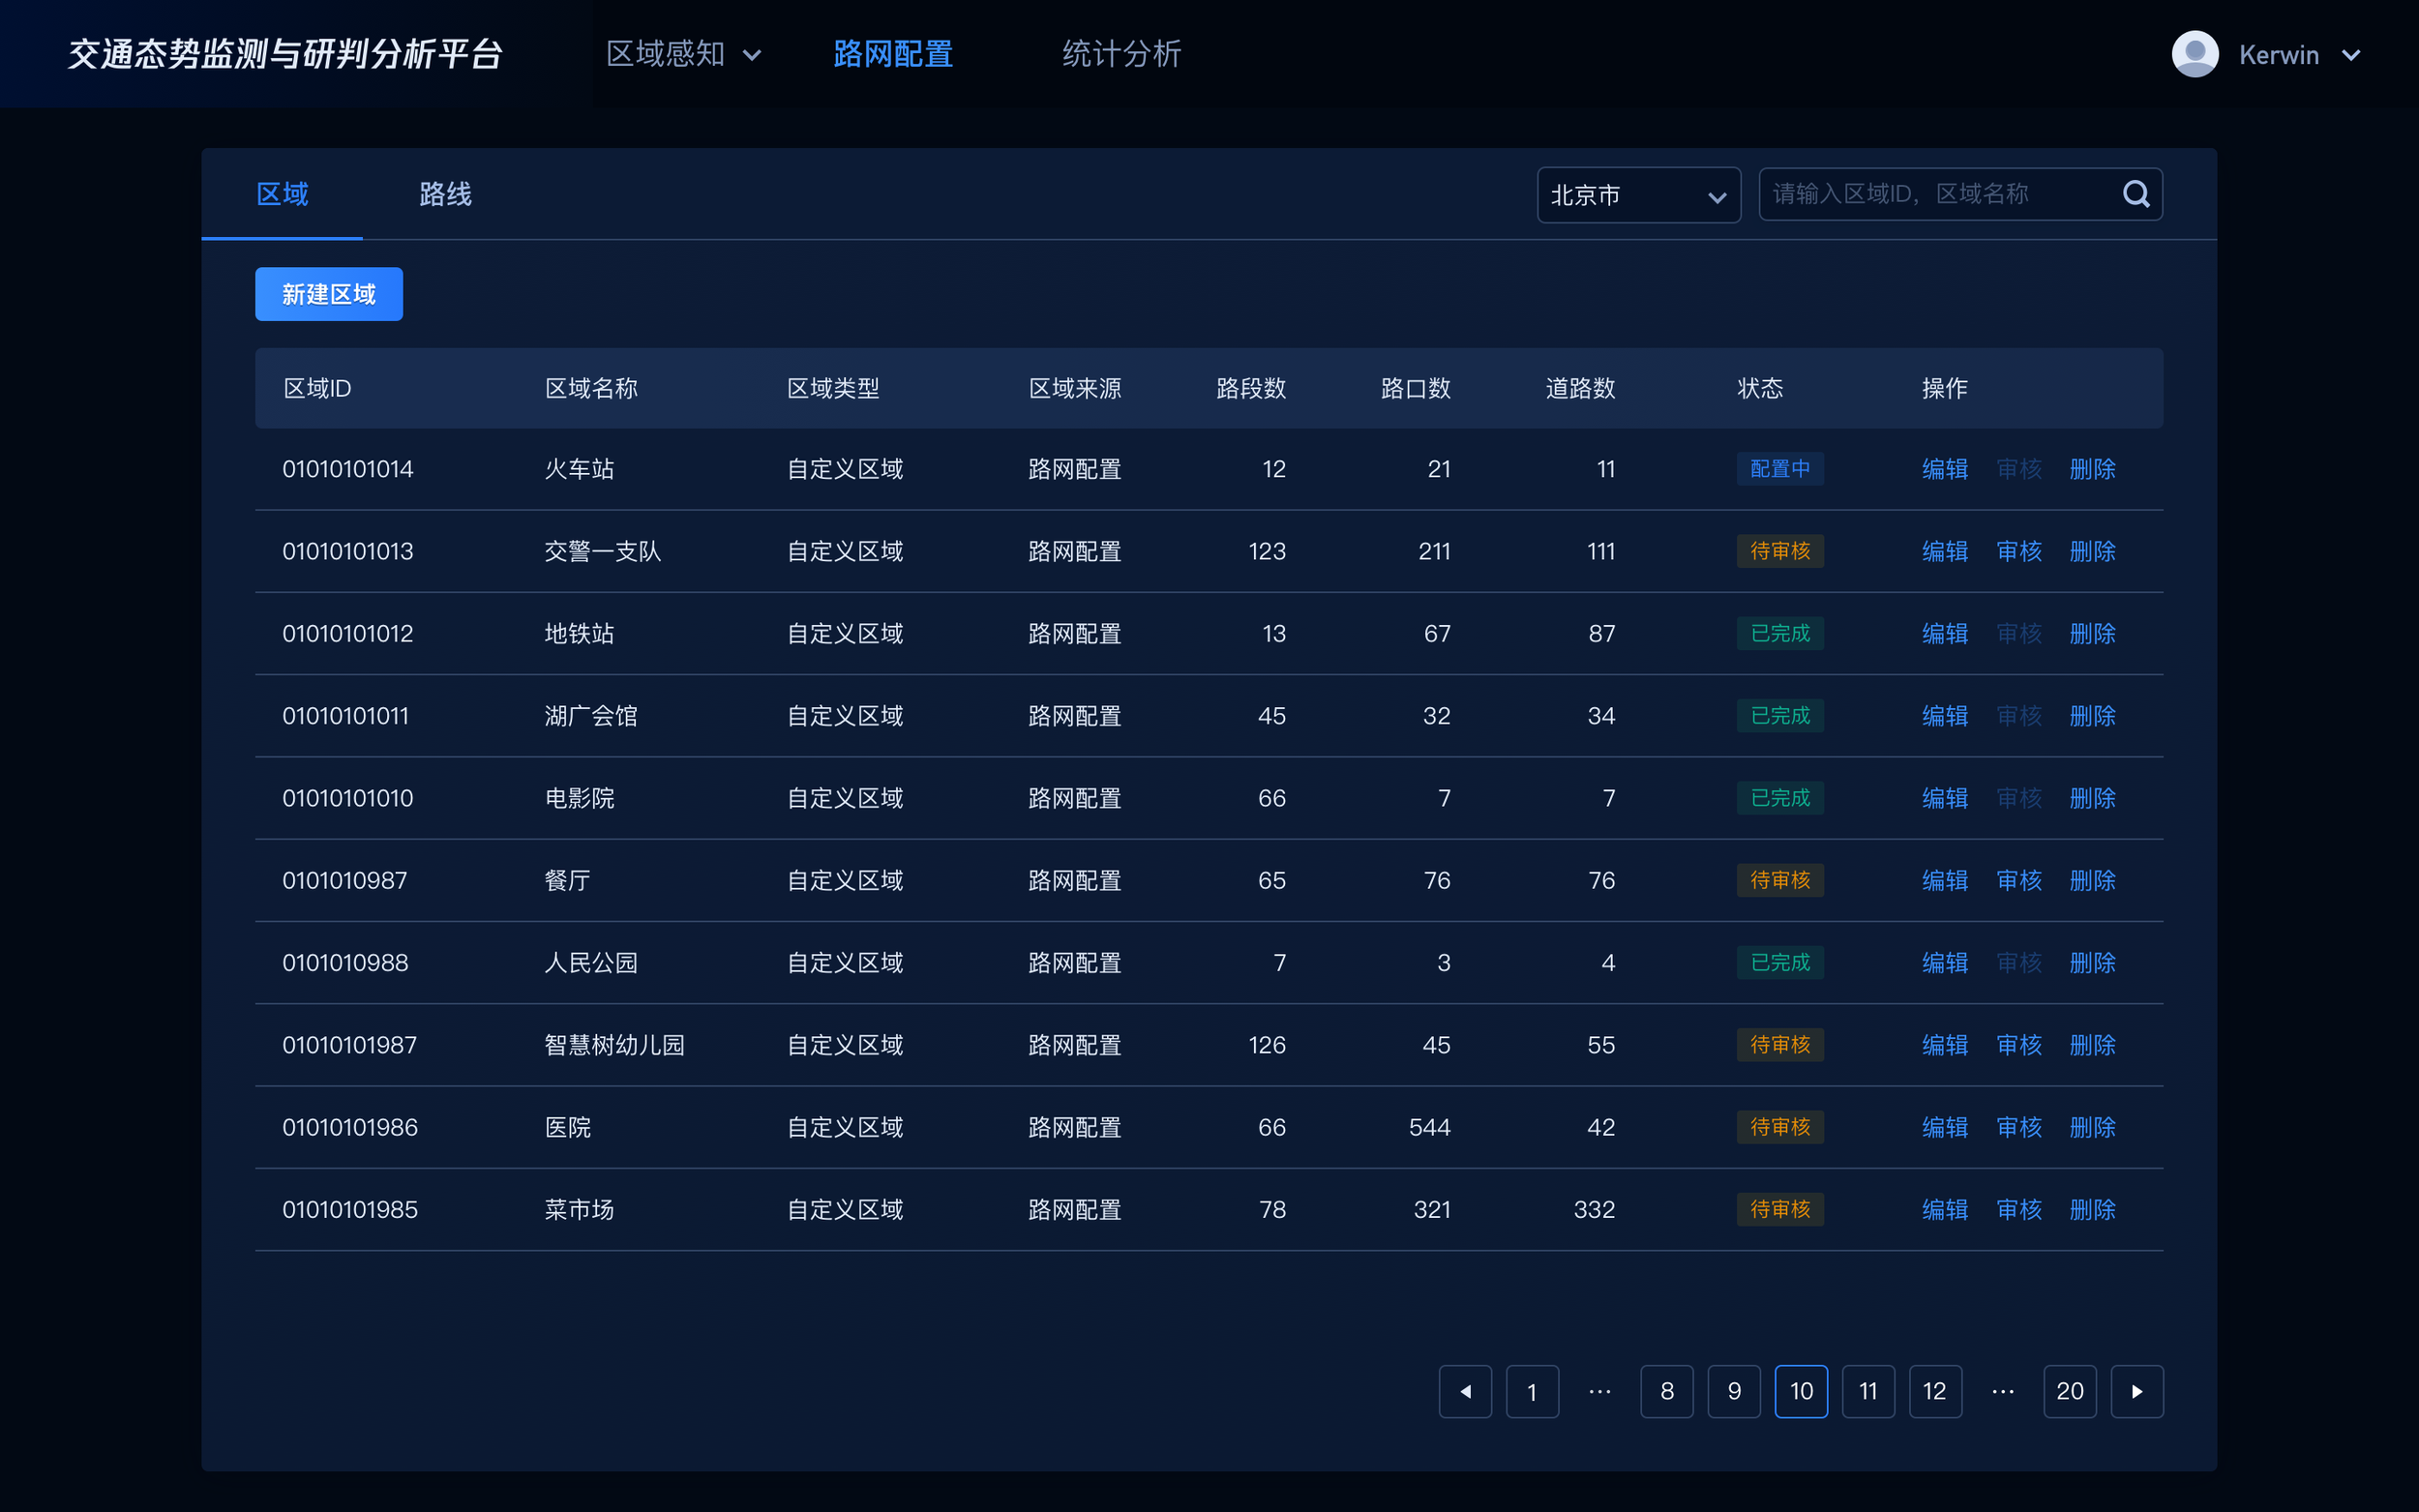
Detailed UI


UNDERSTANDING THE USER
USER PROBLEMS
What are the different roles’ goals and key tasks?

Department Head and Operators’ General Workflow with Traffic Status

Head’s Problem

Operators’ Problem
1. Department head’s goal:
Manage the whole department through each team’s KPI (congestion metrics) and their improvement.
2. Operators’ goal:
Improve the traffic congestion in their responsive area.
3. How can traffic status help operators improve traffic congestion?
Be informed about the real-time traffic conditions of their responsible area assigned by the administration head.
Locate the abnormal congested road sections or intersections that need action in their responsible area.
Decide where to dispatch police officers.
UNDERSTANDING THE JOURNEY
OPERATORS DECISION-MAKING PROCESS
The proposed decision-making process in Traffic Status V1.1 :

The real experience:
Why can’t V1.1 facilitate operators to dispatch policemen?

4. Identify Operators’ Key Pain Points through their journey and reframe the problem:
“Traffic Police Operators could not quickly get customized metrics to identify where to dispatch policemen. “
Each traffic operator has their responsible area, whose metrics cannot be easily found in our system because we only show metrics on an administrative district scale.
Traffic operators cannot get customized metrics to instruct them on where to dispatch police officers.
There are many general metrics that traffic operators don’t care to steal their attention.
OPPORTUNITY
A CUSTOMIZATION TOOL
How can a customization tool facilitate the decision-making

For department head:
A customization feature that quantifies the traffic status of each team’s responsible areas so that I can have an idea about different areas’ performance.
For operators:
A customization feature to get metrics about specific areas so that we can know where to dispatch policemen.
REFRAME THE DESIGN CHALLENGE
ALLEVIATE THE BURDEN OF CUSTOMIZATION
What increases the difficulty of this design challenge?
The road system is highly complex.
There might be thousands of road sections in various types within an area. And operators (end-users) need a fine-grained customization feature that allows them to select which roads should contribute to the customized metrics. This could be a tedious, frustrating, error-prone, and inefficient process.
Users’ customization needs vary.
In order to help operators decide which area needs more policemen, not all roads/intersections within the boundary should be included in the areas’ metrics. eg: smaller roads, roads without traffic lights, frequently congested roads may not need to be calculated for the customized metrics under specific conditions.
“How might we deliver one simple customization tool that covers operators' various customization needs?”
IDEATION
IDENTIFY THE SHORTEST PATH FOR CUSTOMIZATION
User stories are used to streamline customization needs and find the shortest path to customize an area.


DEFINE
KEY FEATURES
-
✦✦✦Customize Area
Draw area boundaries
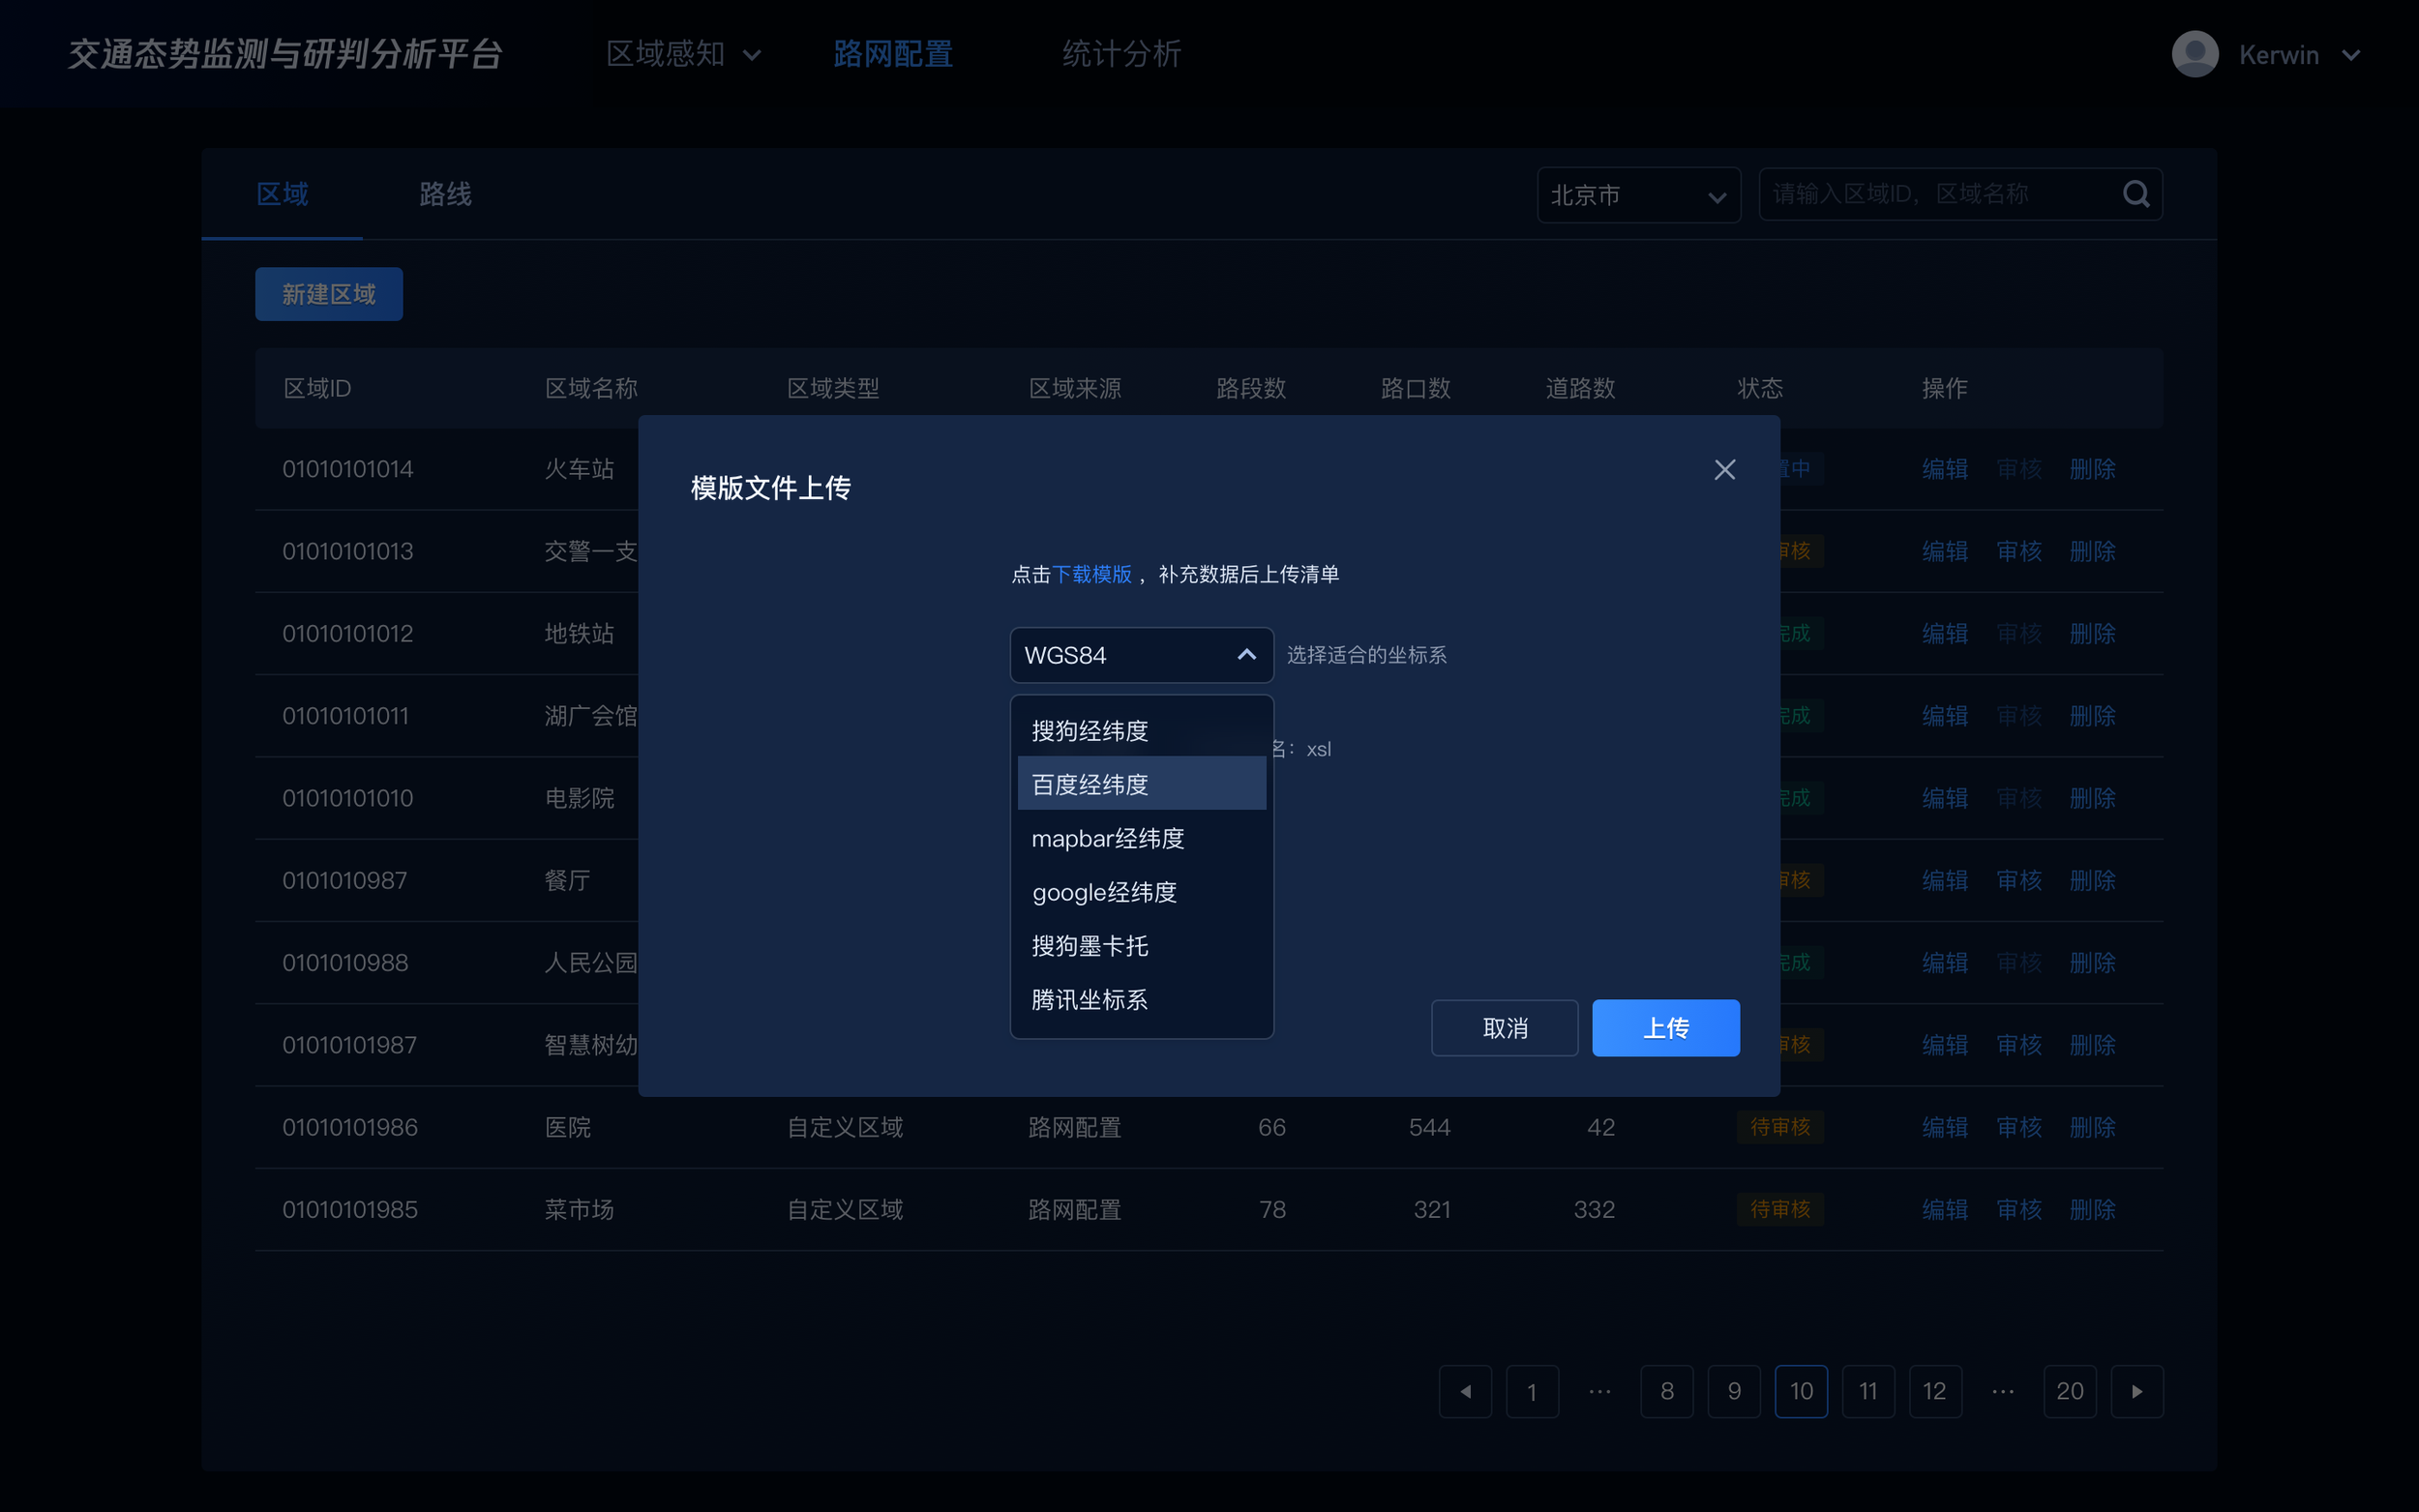
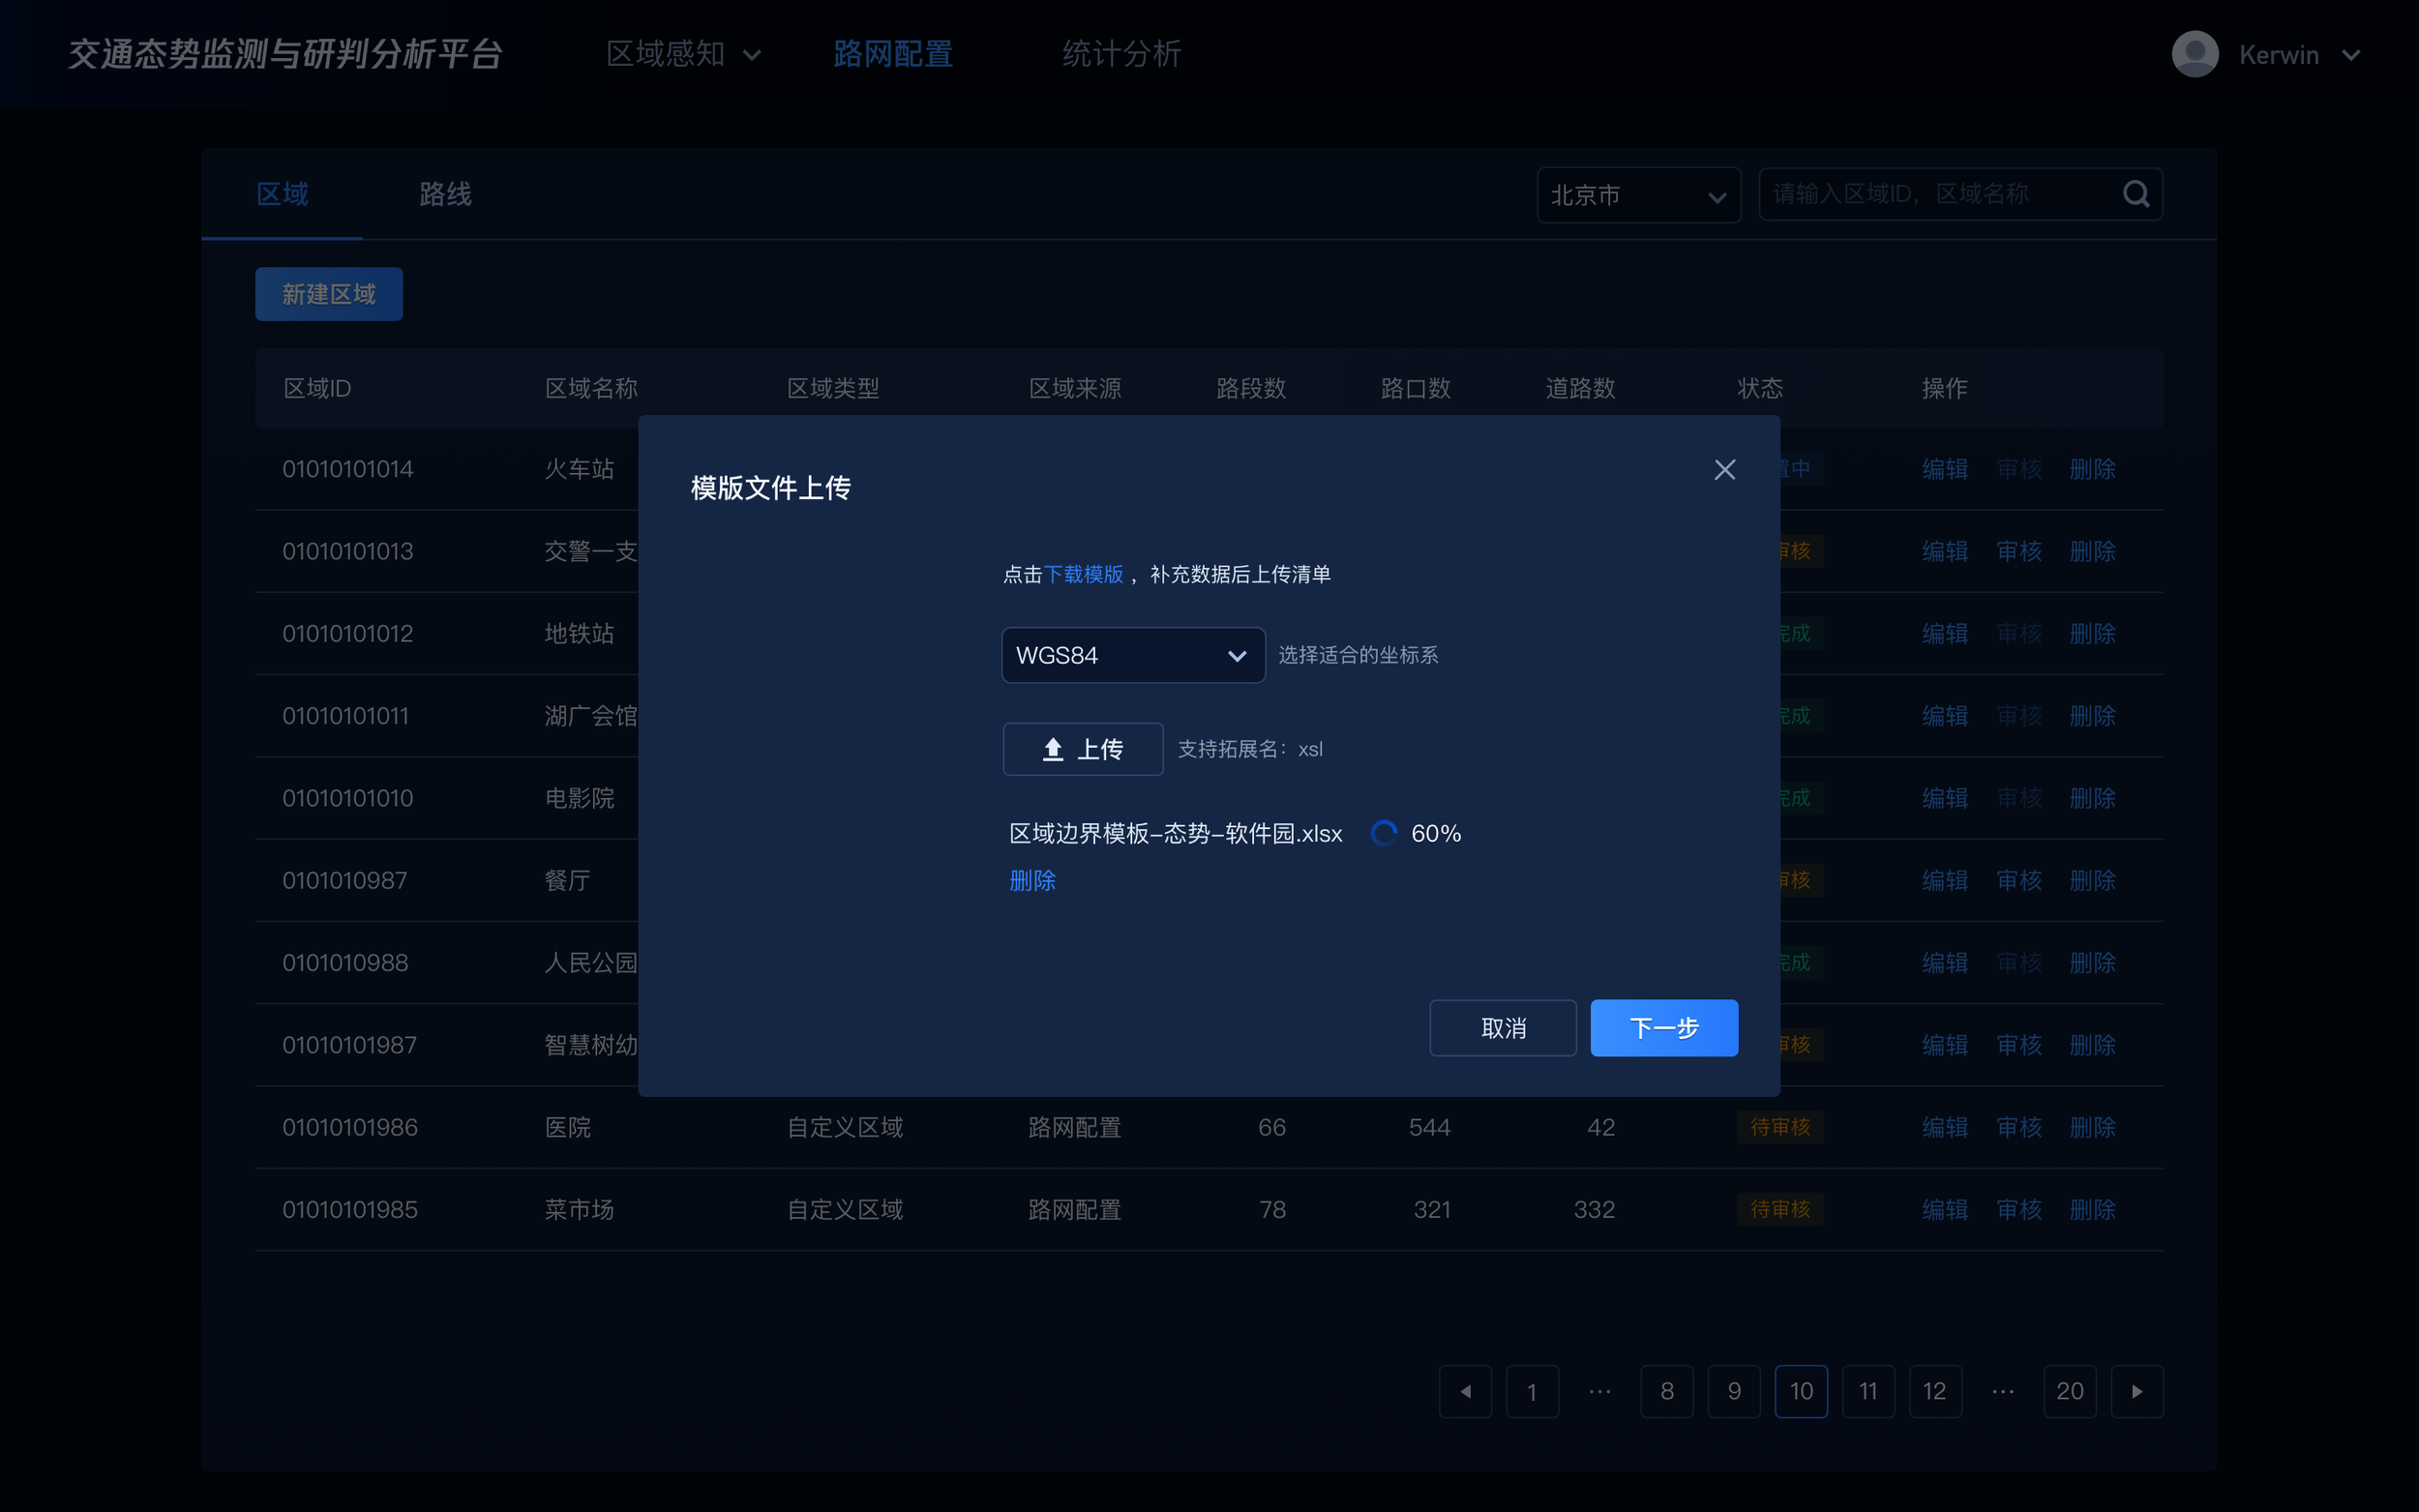
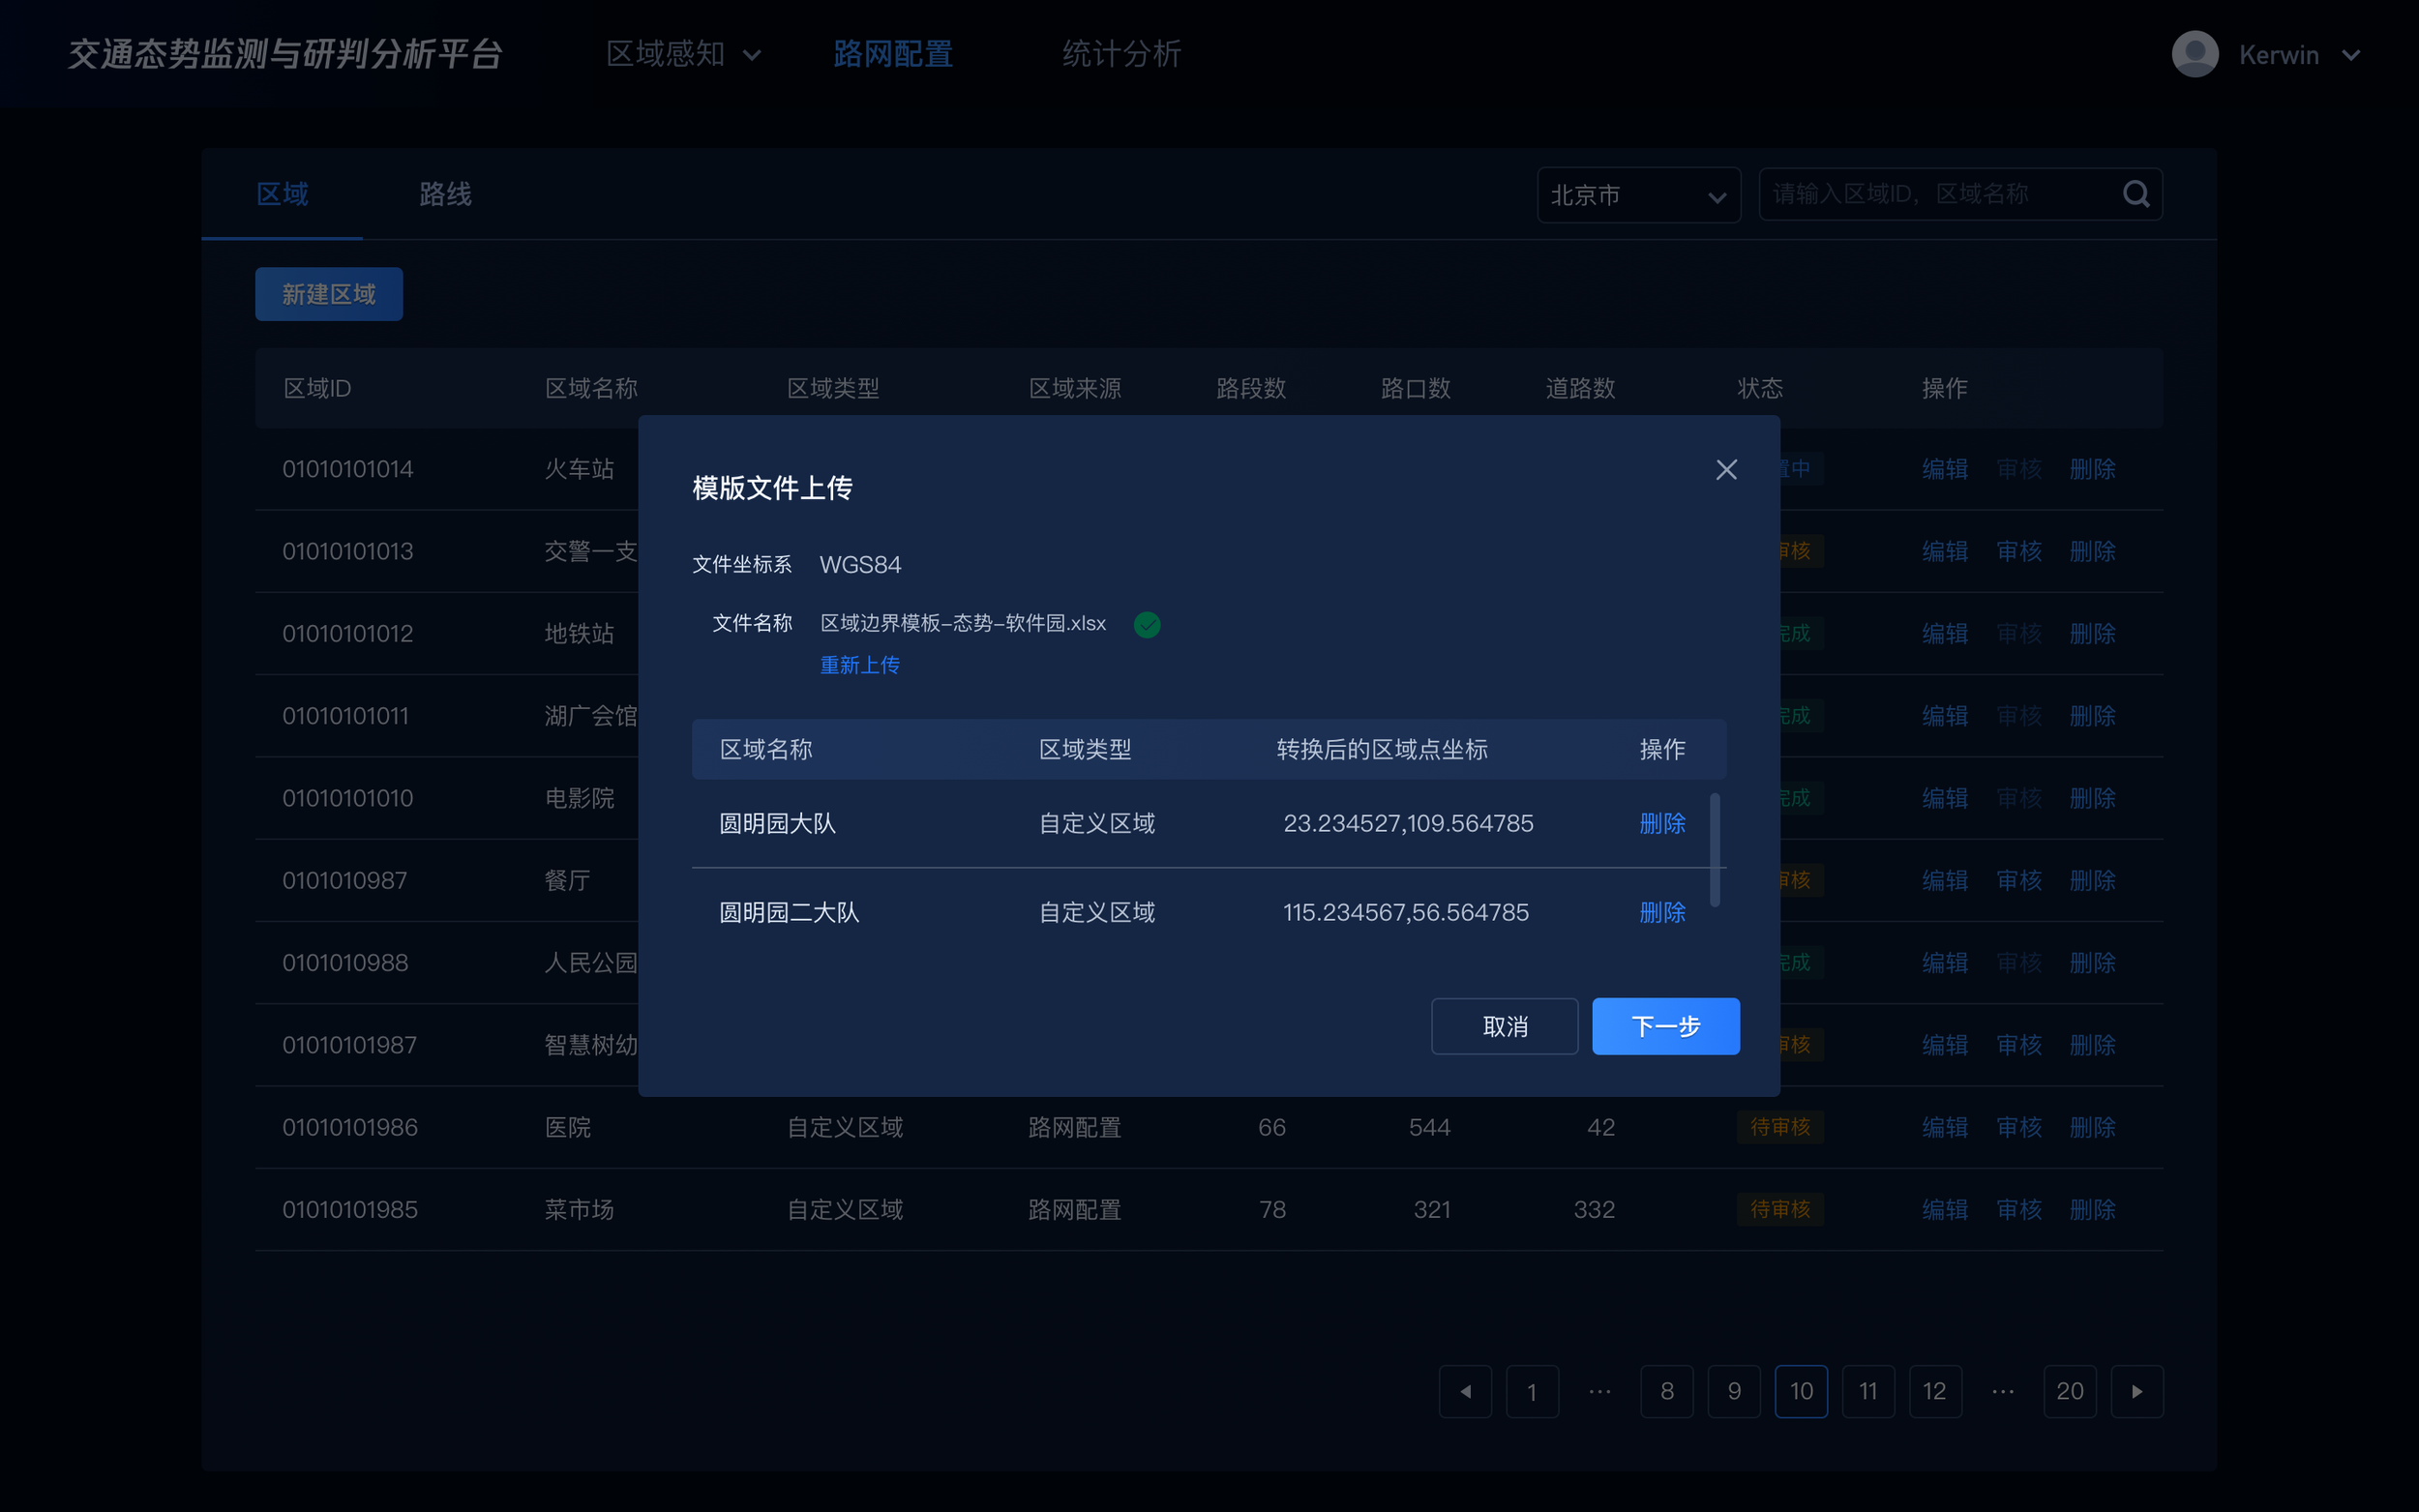
Upload area boundaries
Choose road type
Delete unwanted objects
Store the area and its roads
Get metrics about the area and the roads
-
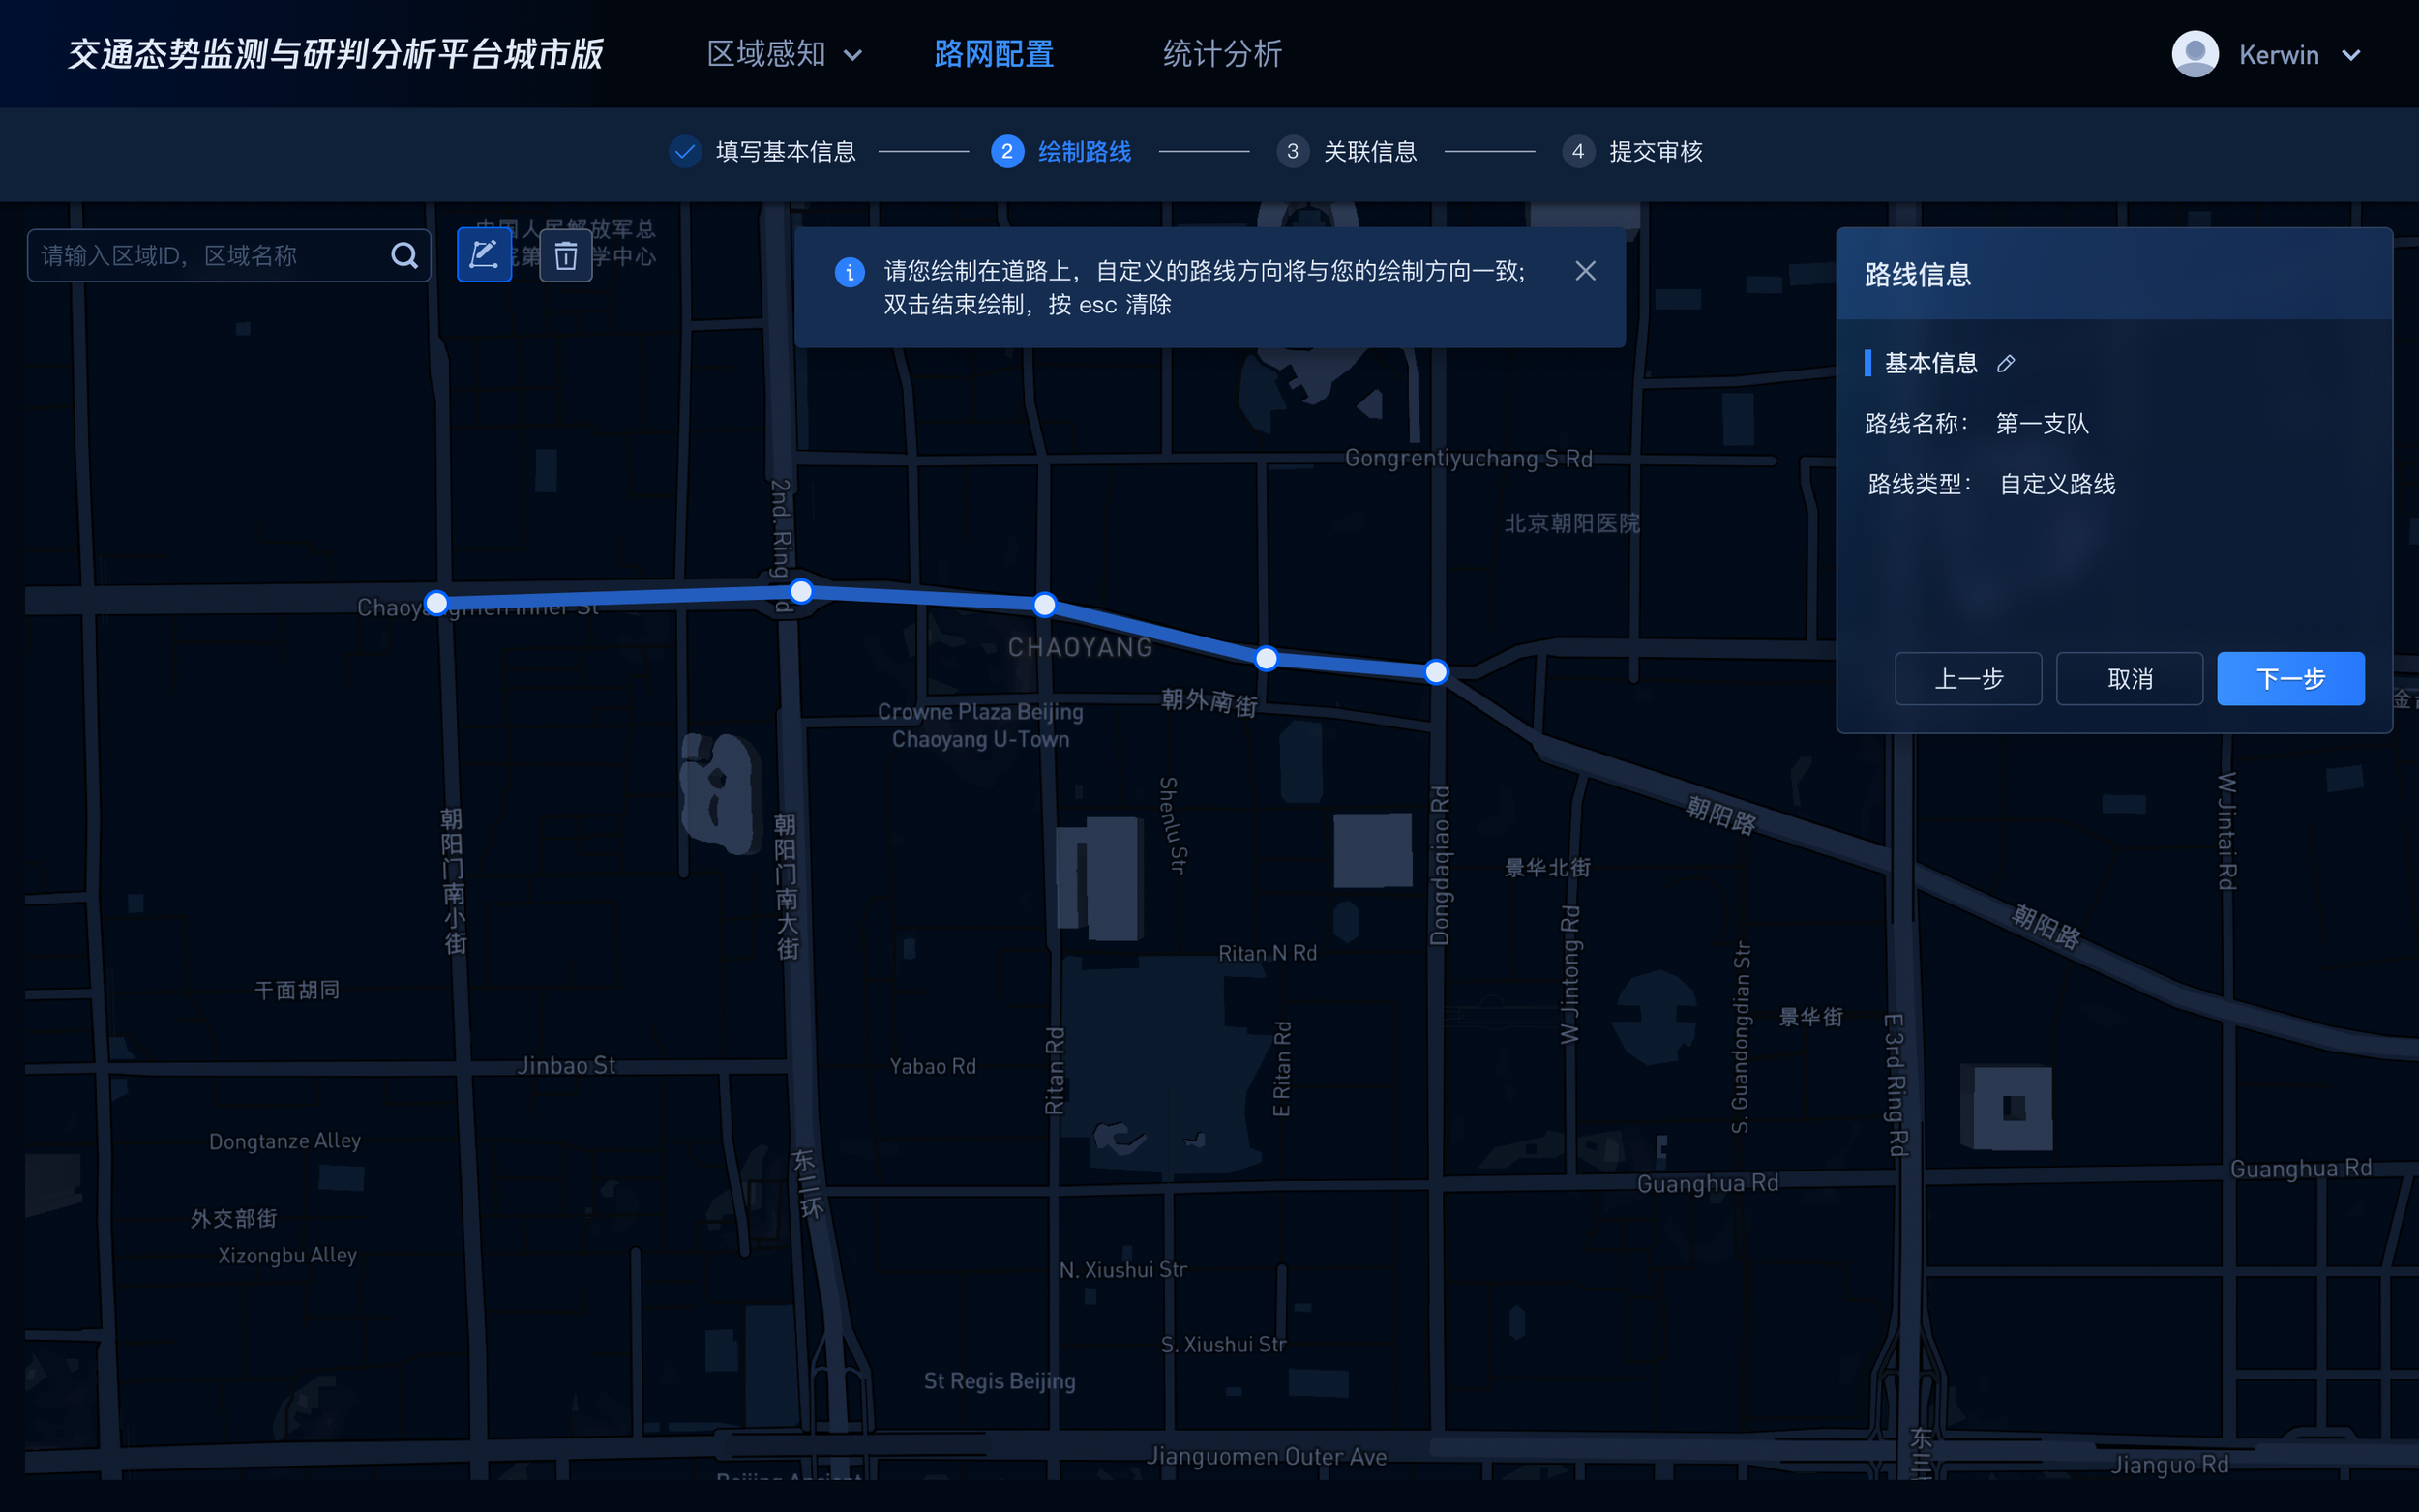
✦✦Customize Road
Draw a line with the direction
Upload a line with the direction
Choose road type
Delete unwanted intersections
A new road is created and stored
Get metrics about the road.
-
✦✦✦Show metrics
Show customized areas and their roads’ metrics on the first page
Show the frequent/sudden congested roads for customized areas on the first page.
Show customized roads via one click
DESIGN
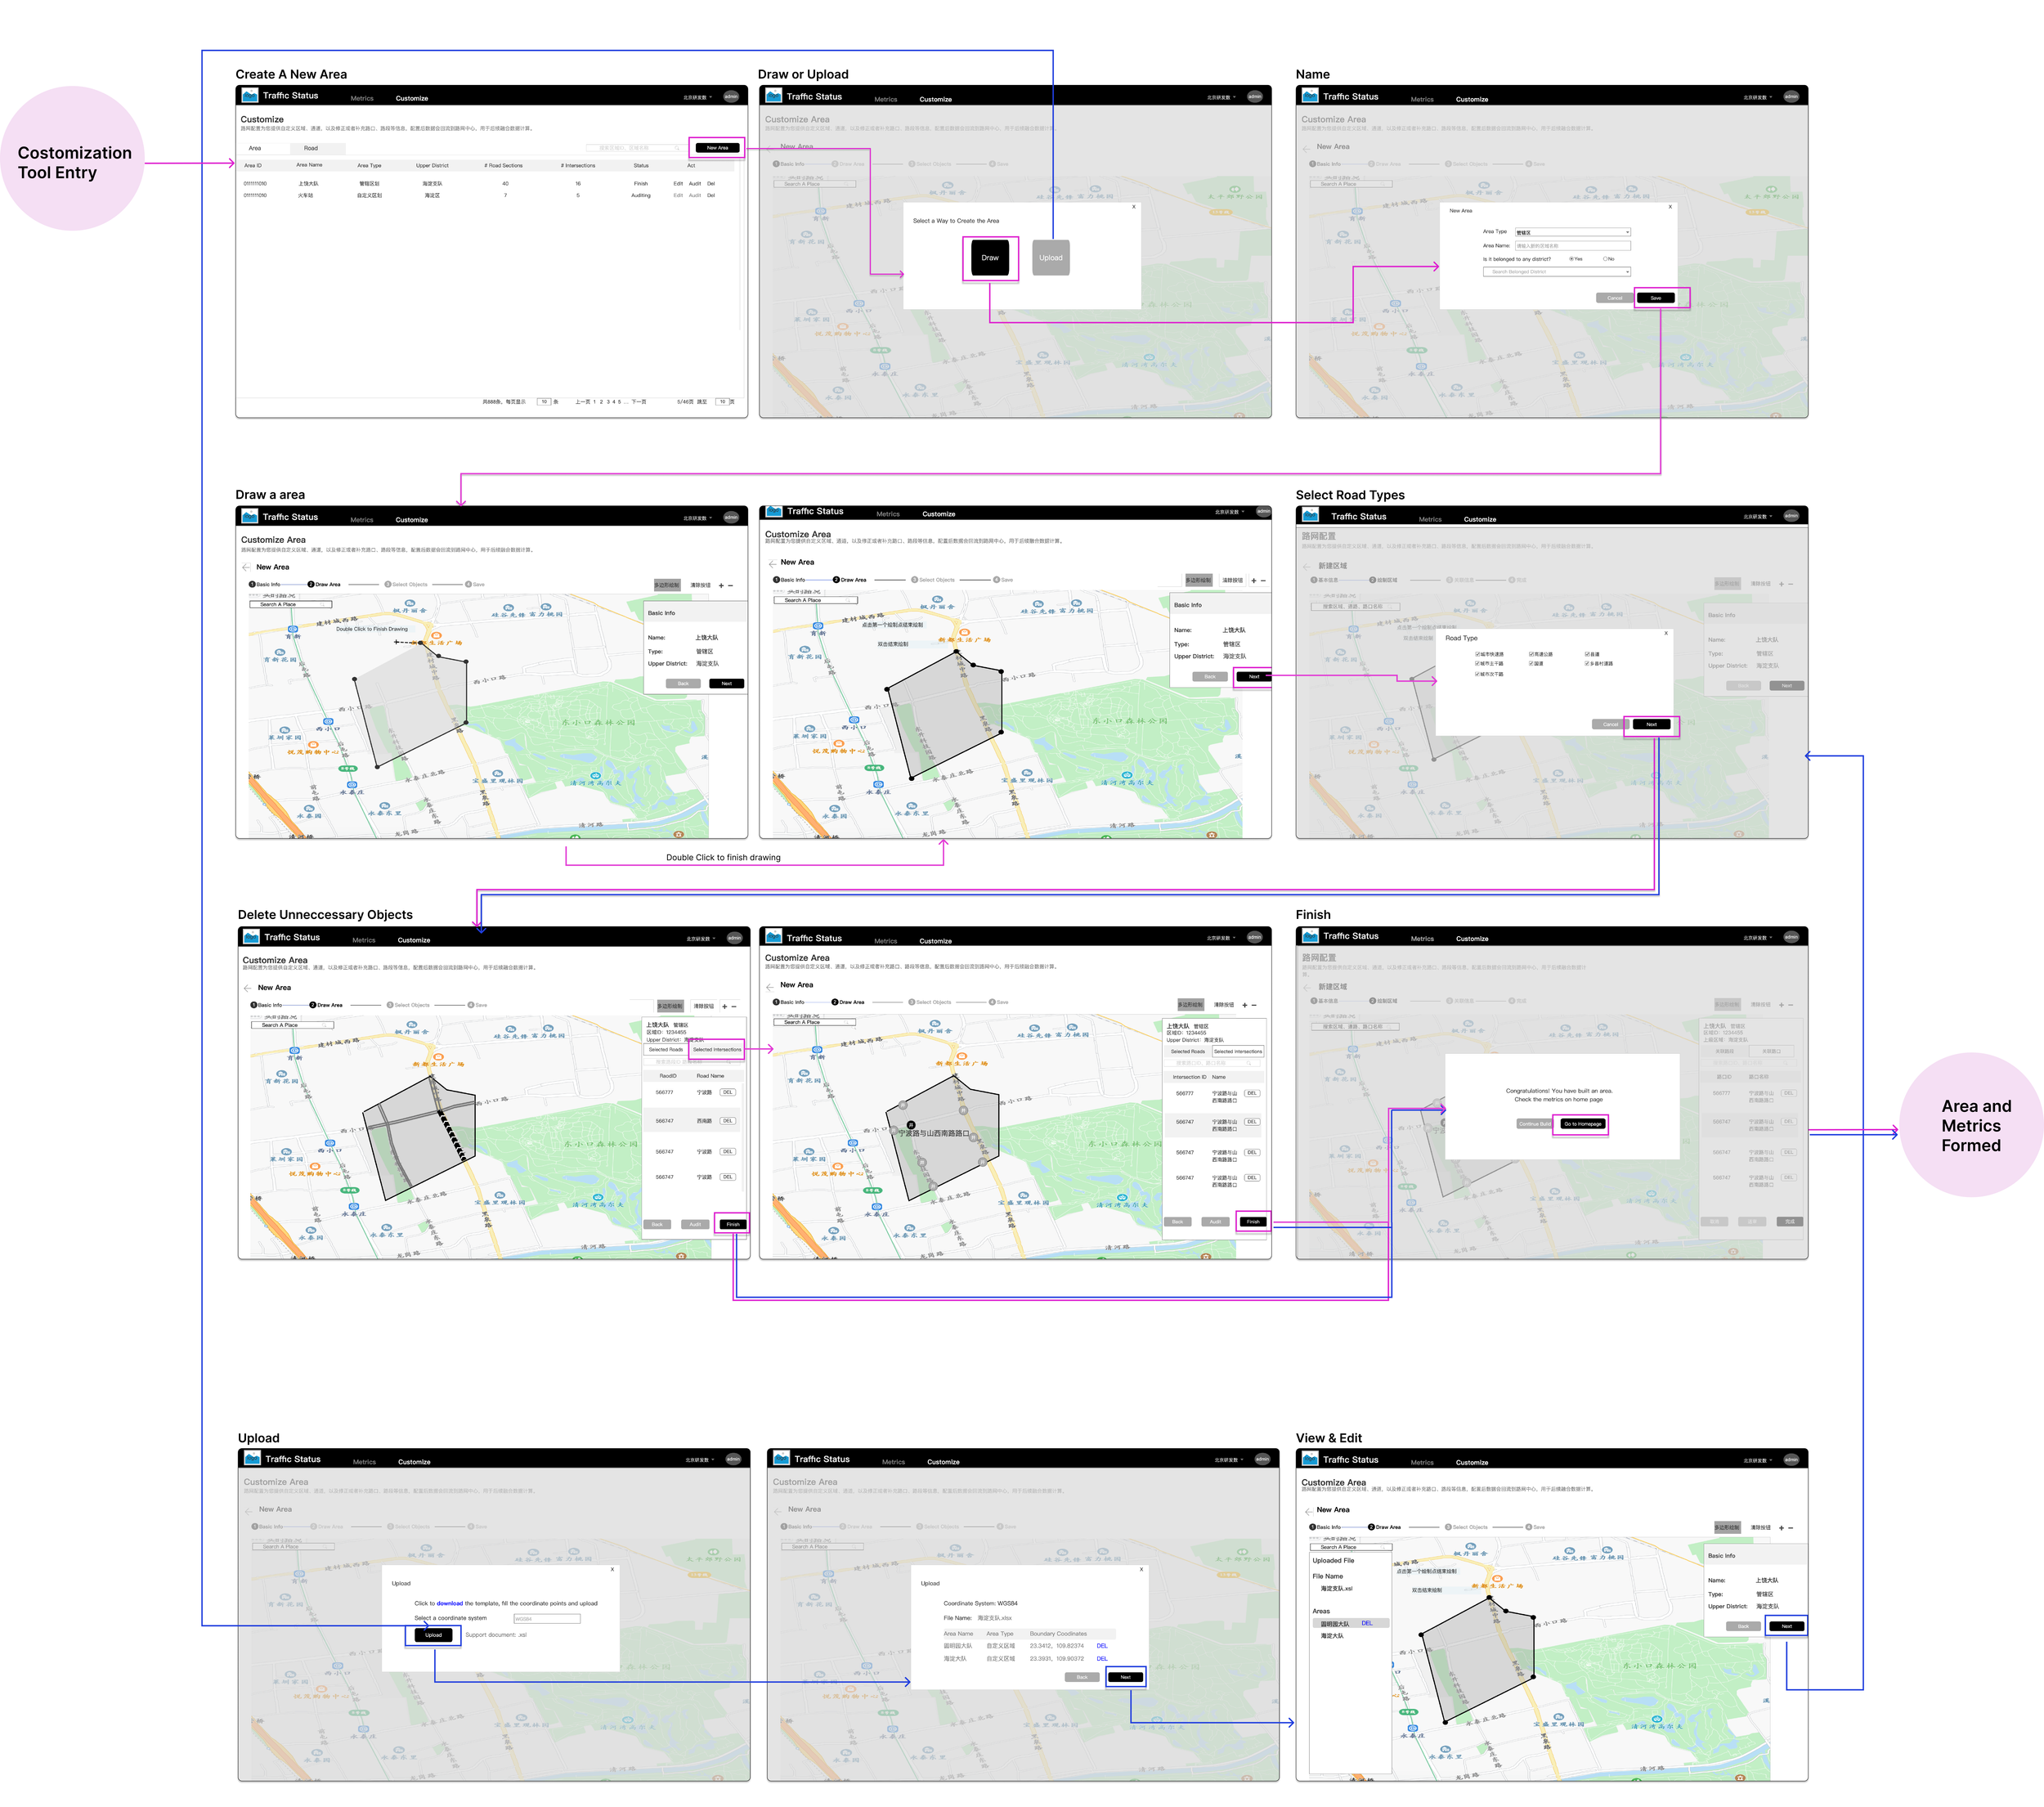
MAP THE USER FLOWS AND WIREFRAMES
User Flows for key tasks help us identify how the customization tool improves operators’ workflow.
1. Customize Areas Or Roads
2. Show Customized Metrics

3. Key improvements after customization for operators’ workflow
One-click to show any customized area’s metrics and its roads rank & metrics.
Another click to get the insight metrics about a road in a customized area. - whether it is sudden or frequent congestions and historical data - facilitating decision-making for dispatching traffic policemen.
Another click to know customized road metrics, with only selected intersections and road sections, providing insightful metrics about traffic light adjustment.
Wireframes are designed based on the user flow to get feedback from users.
ITERATION
A SEAMLESS, FLEXIBLE, AND ERROR-TOLERATE CUSTOMIZATION JOURNEY
Usability tests are conducted to see if we create a seamless, flexible, and error-tolerant customization journey for users.
Iteration 1: Change elements’ position for a seamless experience
Before:
The pop-up window for road type selection interrupts users' experience.
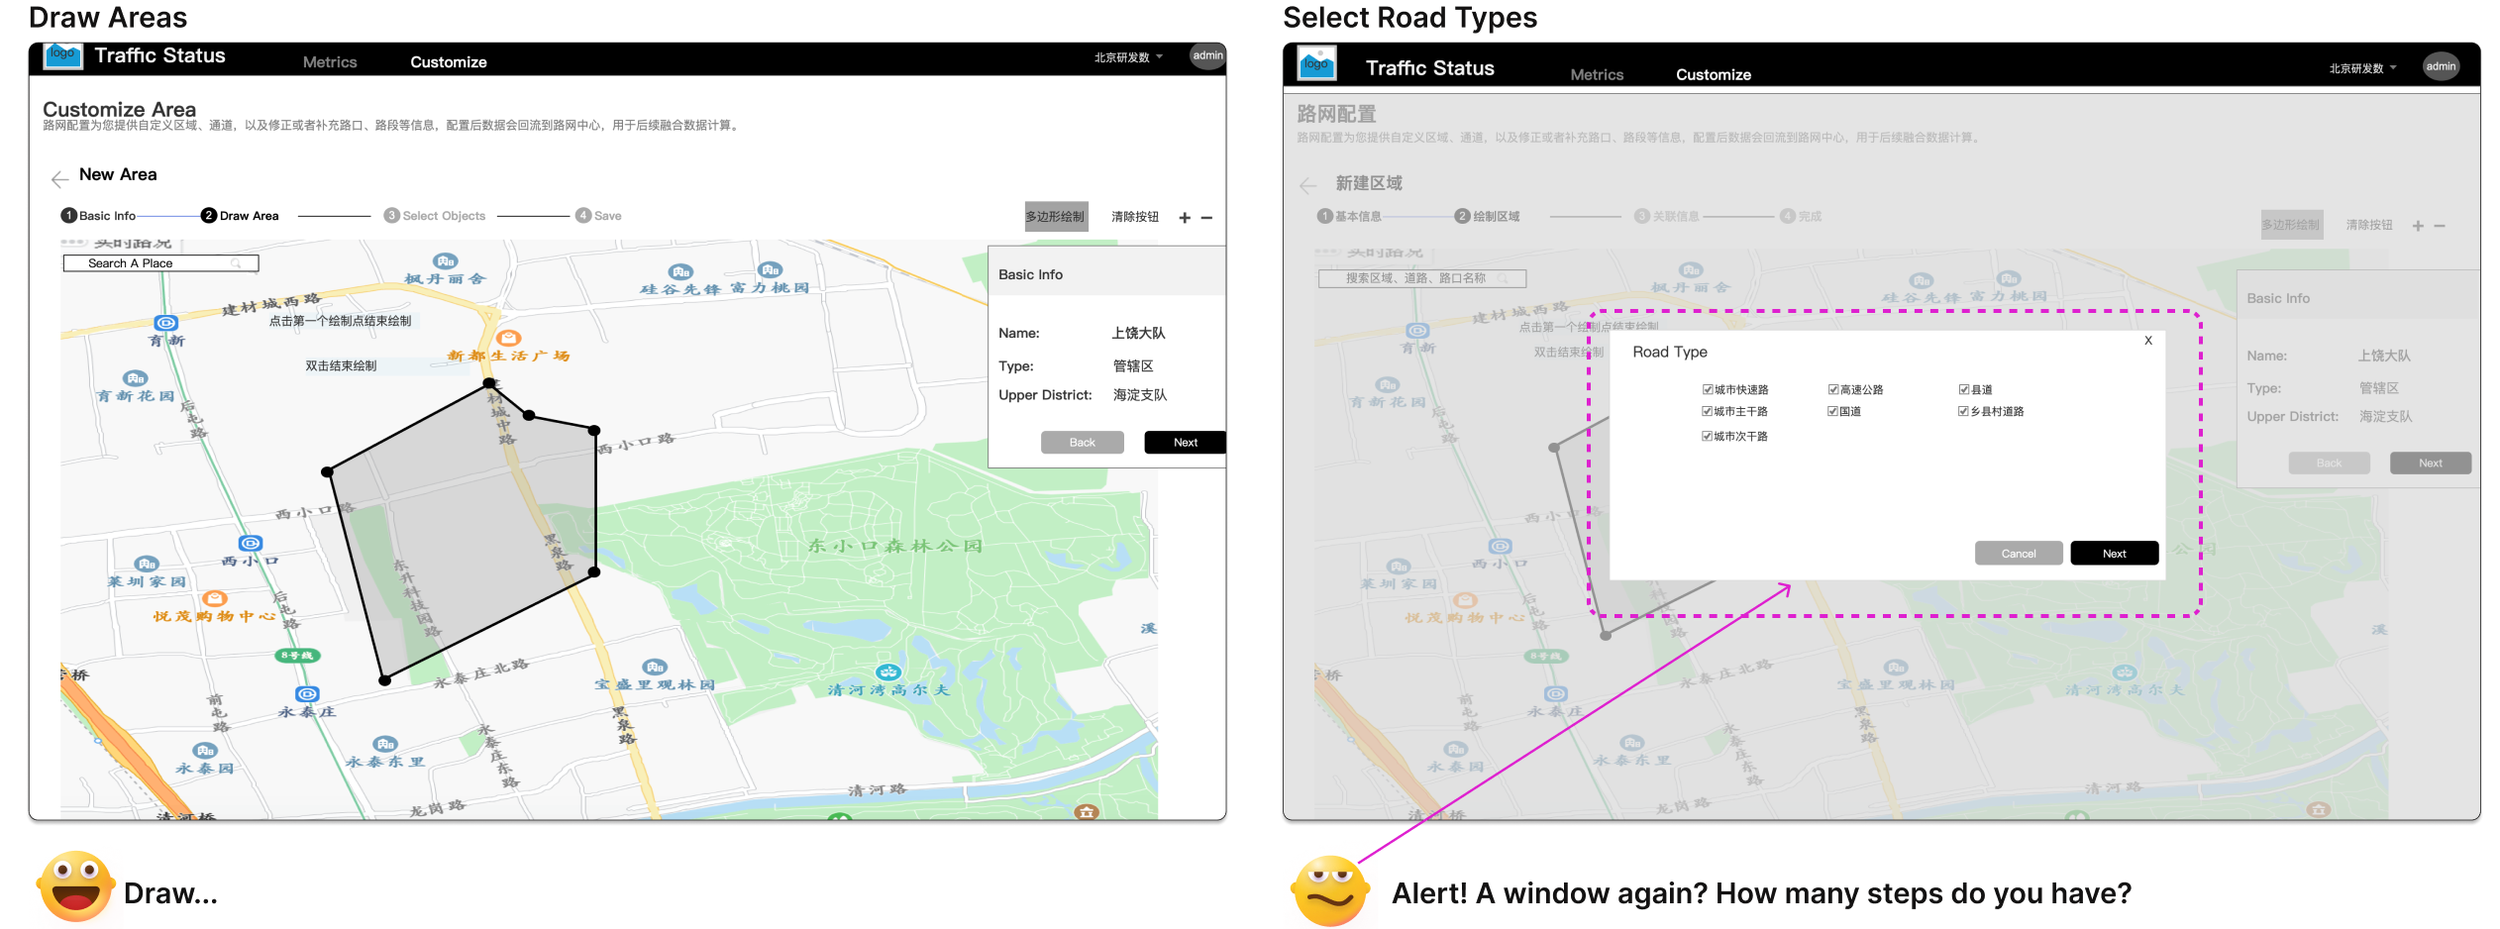
After:
The sidebar for road type selection makes the whole experience more seamless.
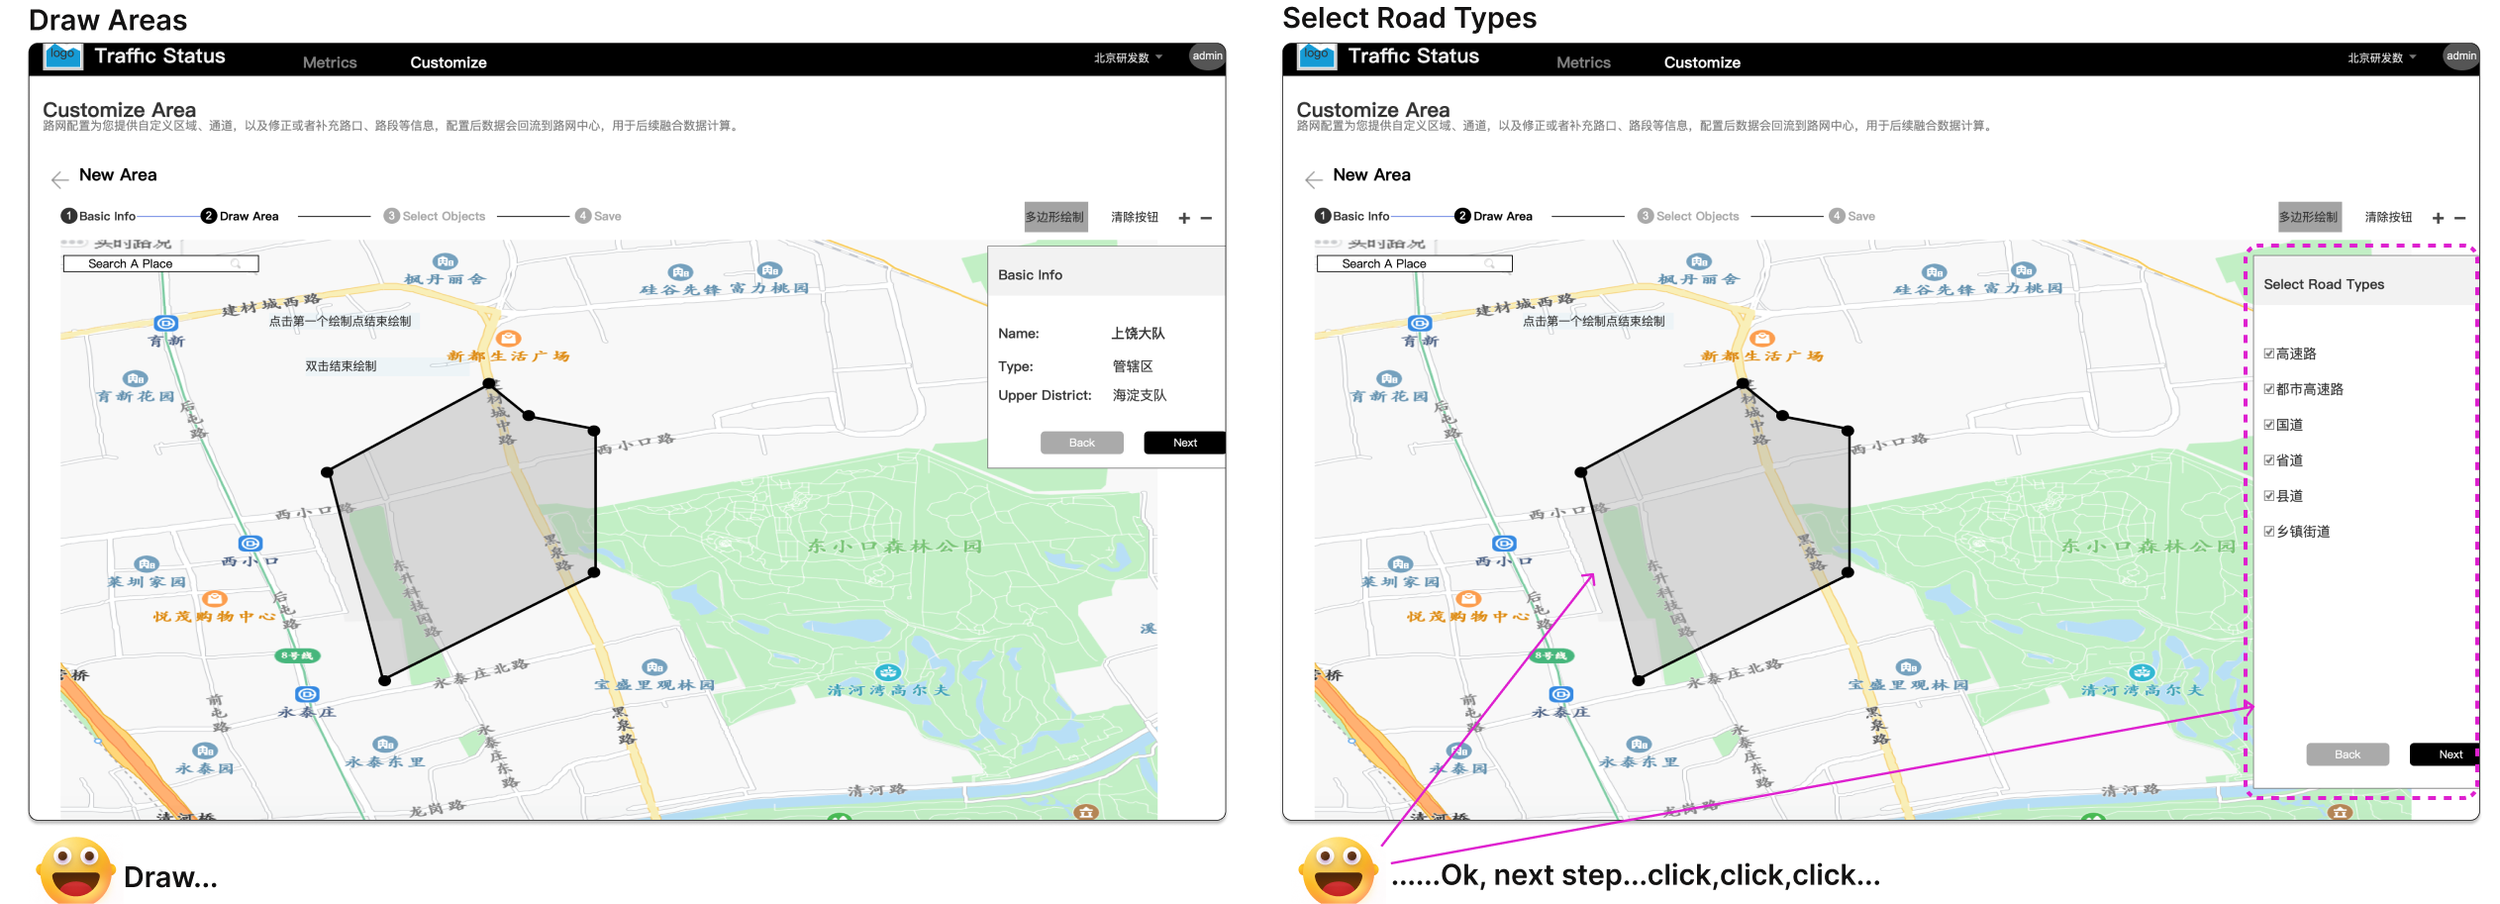
Take away:
When designing a long process for users to finish, try to reduce friction by making elements consistent. Let users complete the whole process seamlessly.
Iteration 2: Create more flexibility for drawing boundaries
Before:
For the task of “Draw an area and adjust the boundary,” testing users found it hard to adjust boundaries by merely moving the fixed amount of points they initially drew.
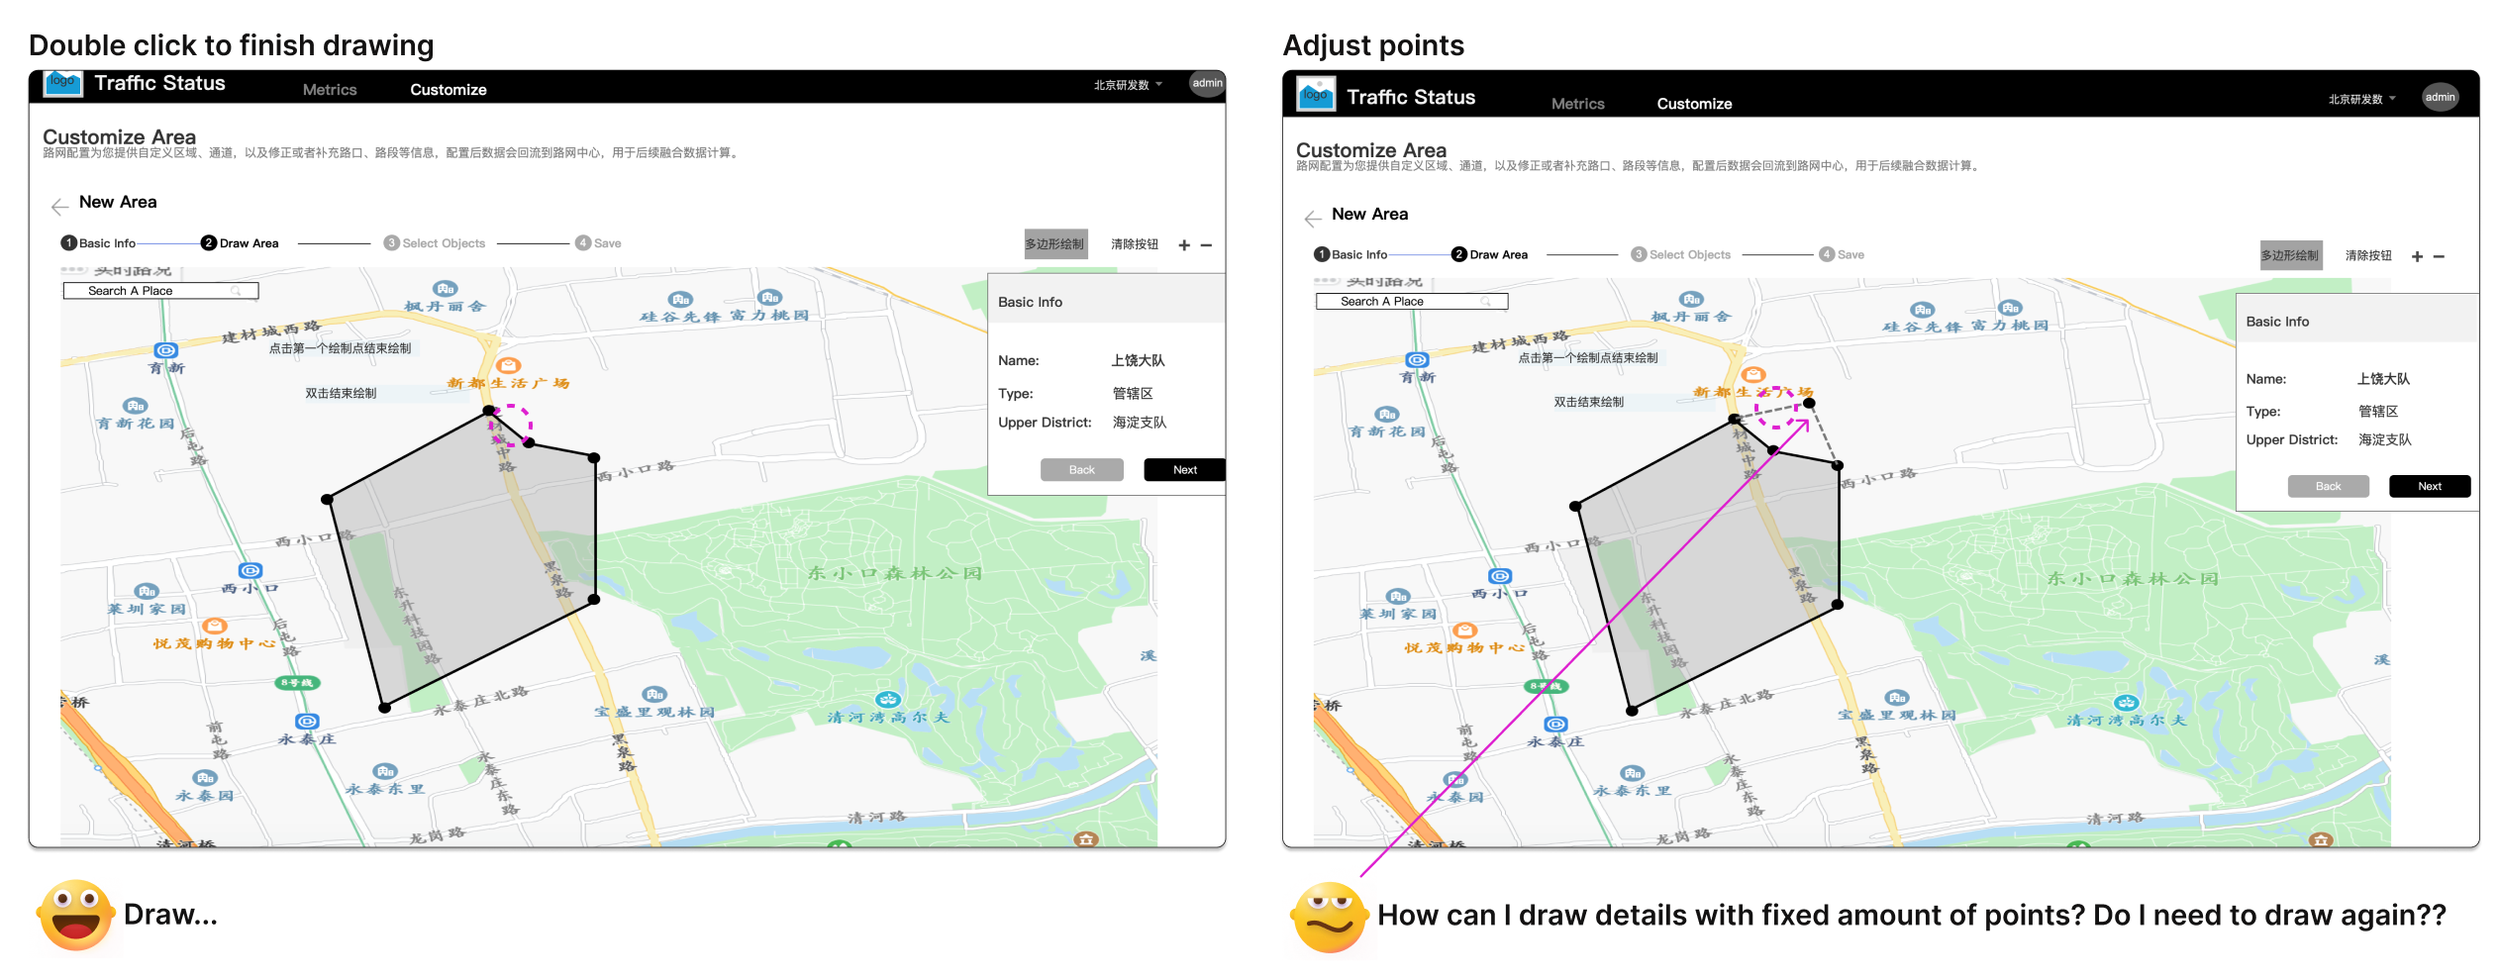
After:
So we changed the drawing process - When users hover over their initial drawing points, midpoints will automatically generate for users to adjust detailed boundaries.

Take away:
Think through the real situation when users do this task. Users cannot make perfect actions the first time. We must provide them with clever tools to adjust details instead of drawing again.
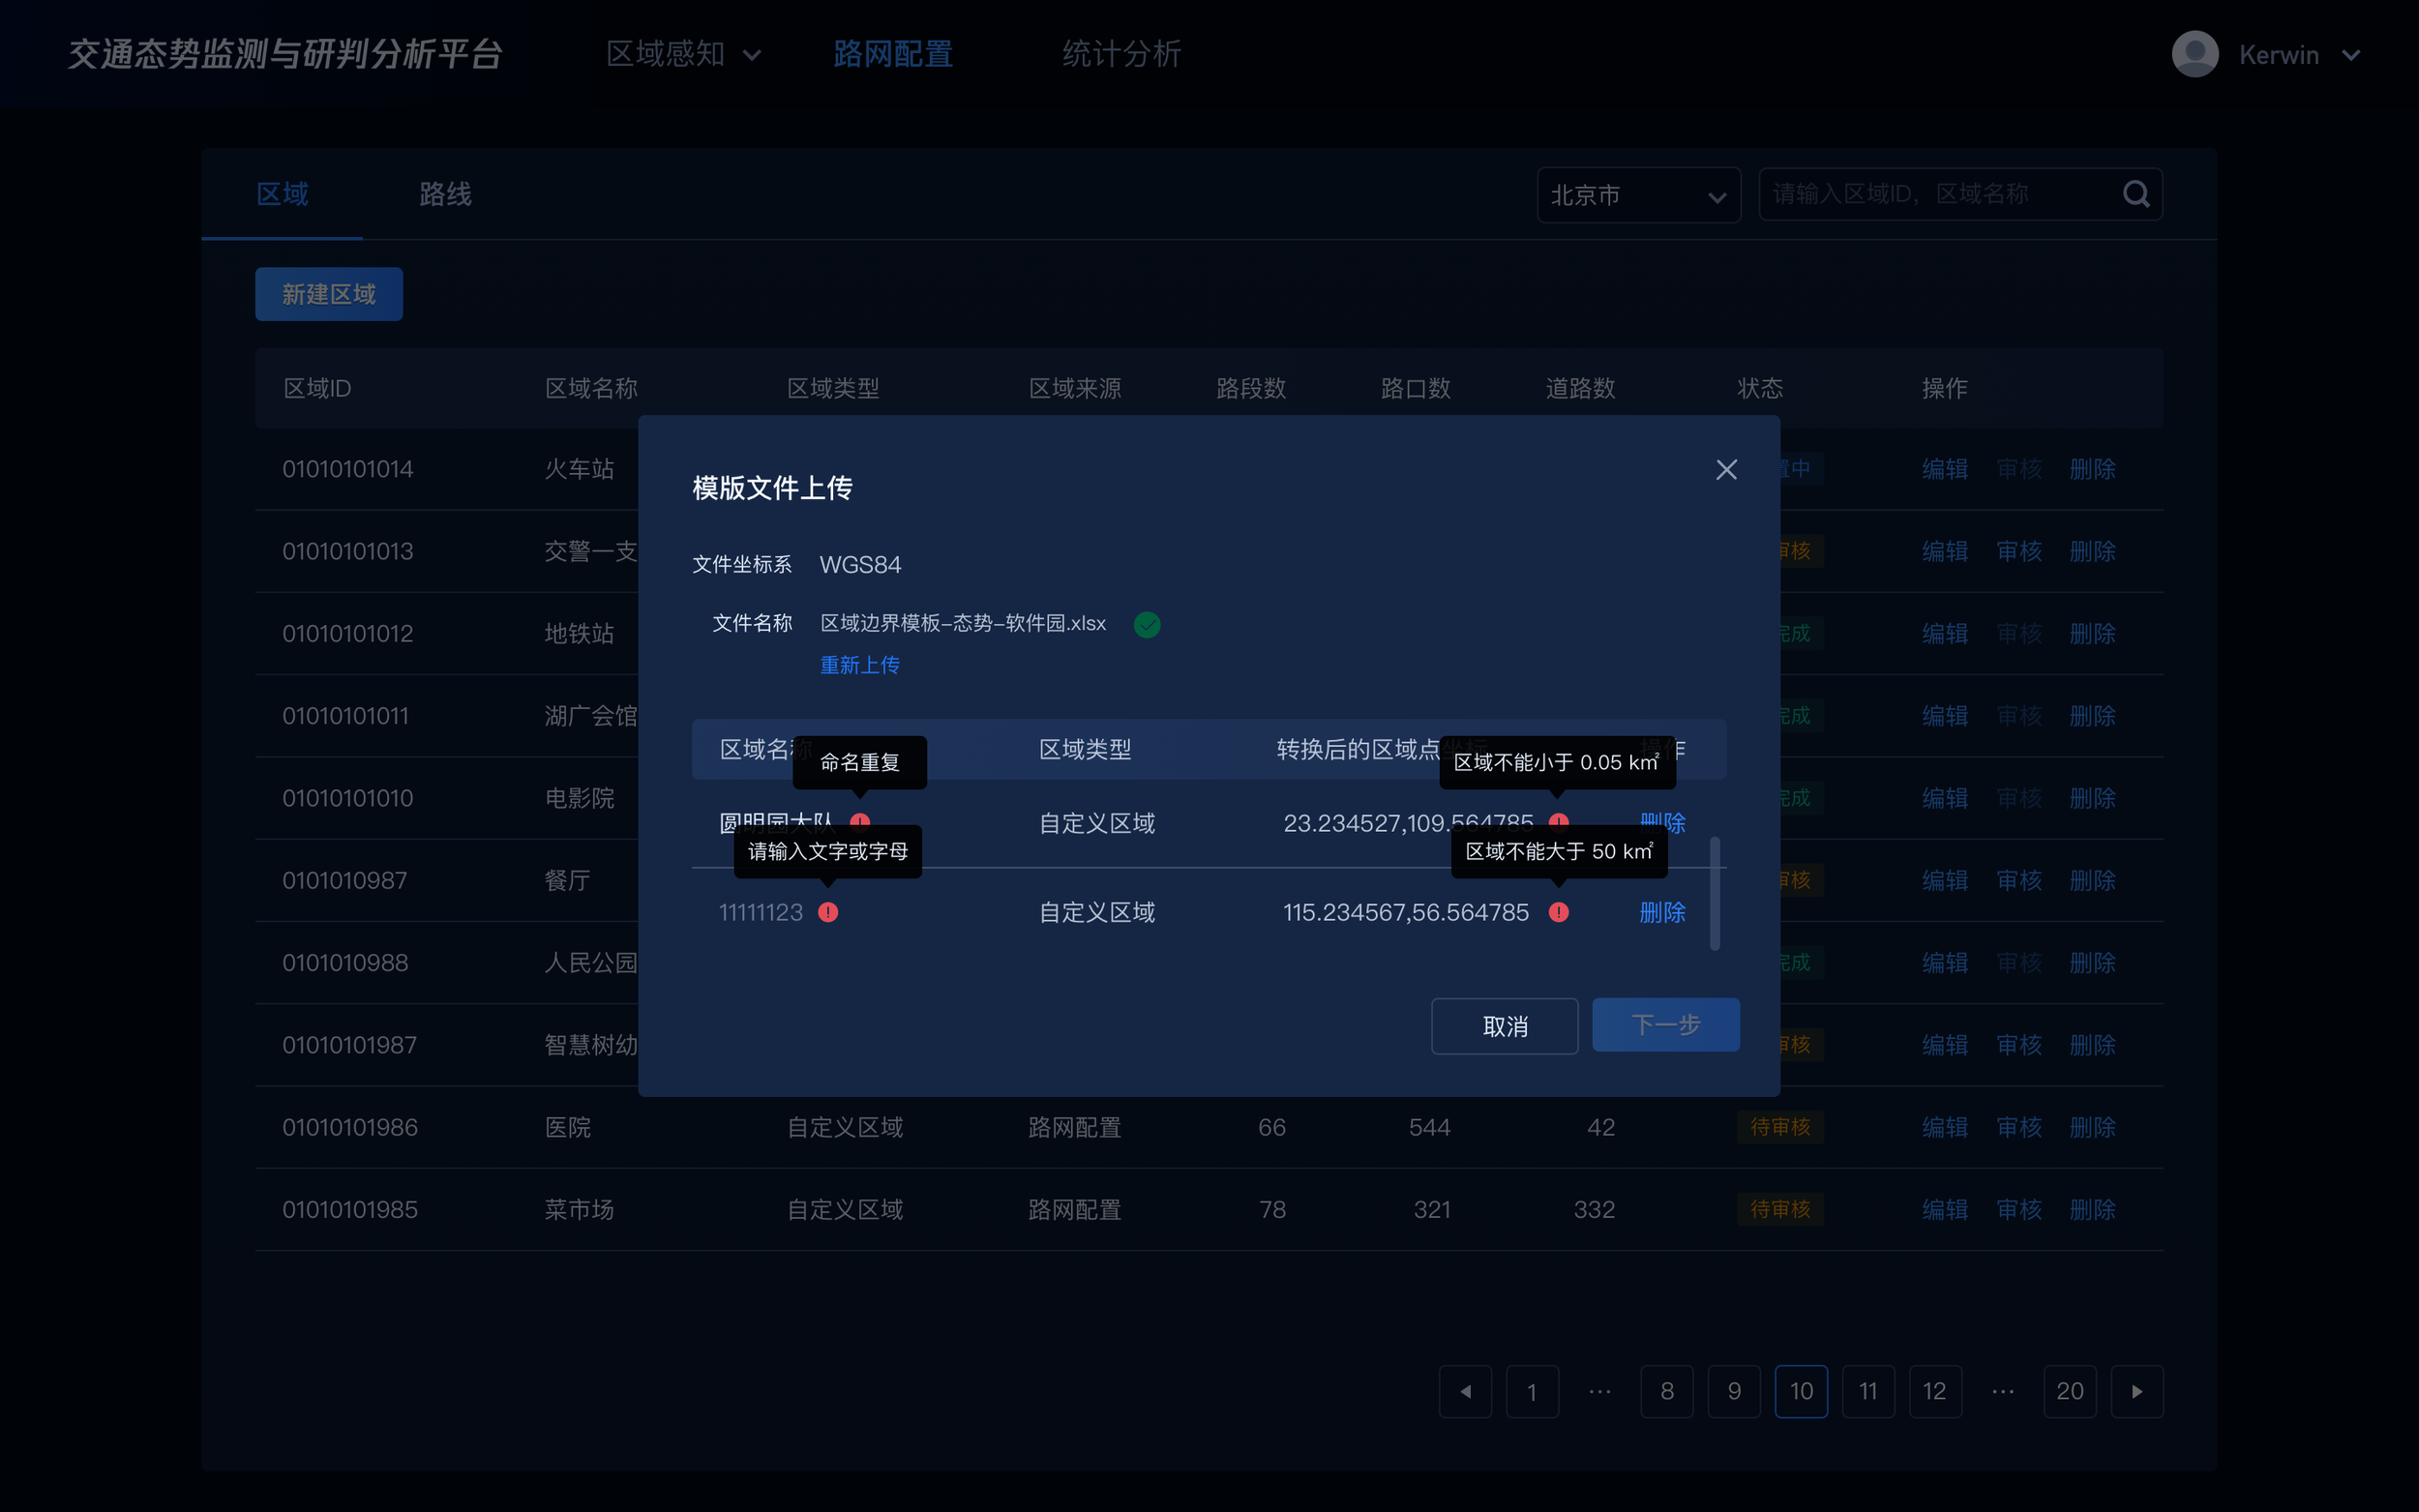
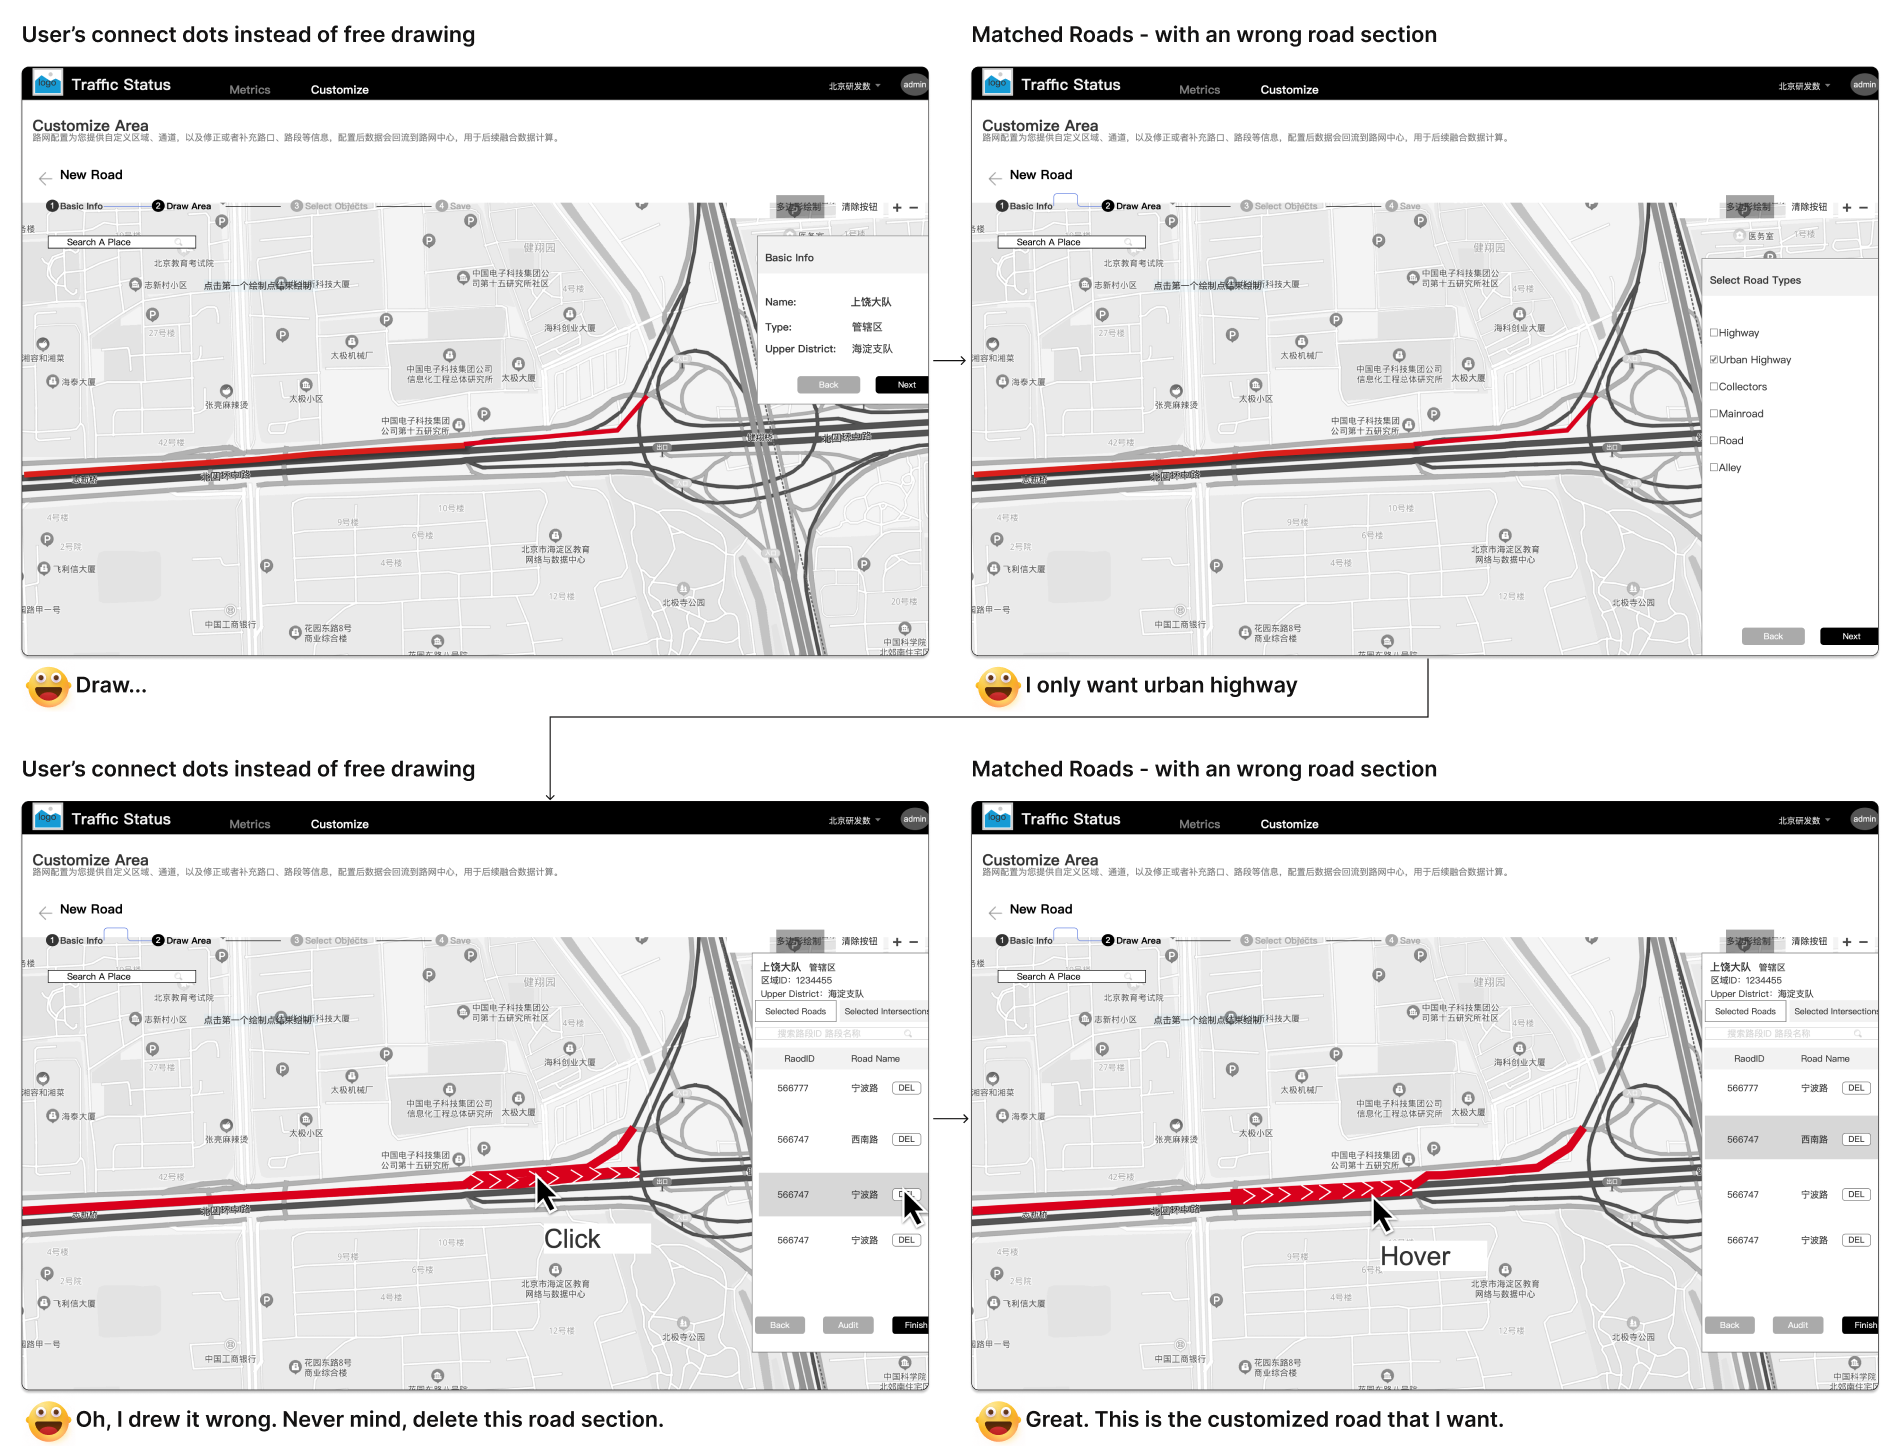
Iteration 3: When the user did not draw correctly on the roads, further customization to embrace more errors for users.
Roads are intricate and intertwined with each other. Users are easy to make mistakes. How can we let users pleasantly correct errors without letting them do repetitive jobs?
Before :
Minimize the wrong case rates while affecting the whole experience: Let users connect dots in case they didn’t draw on any road.

After:
Enable users to quickly and easily adjust the results when they didn’t draw it right. Do not let the conner case influence the whole experience.
Filter road types to match more precisely.
If there are still some wrong road sections, users can easily delete them.
Take away:
Never expect users will be perfect. It is our task to let them fix the error easily and pleasantly without having to draw again.
However, we are not supposed to let the “wrong case” influence the “right case” pleasant experience. That’s why the before solution is not the best. Sometimes, if trying to make sure users behave right will make the experience harder, then try other solutions.
Final Result
Costomize Areas

Customize Roads

Show customized metrics
TAKE AWAY
Marketing managers, engineers, and customers are precious companions to work with. But when they give us advice, we need to think twice and ask why before taking it. By doing so, we can understand the underlying reasons and put ourselves in their shoes. As a product designer, my role is to be responsible to users and reach our product (business) goal.
This is a long project. Thank you so much for your time.
Other Projects
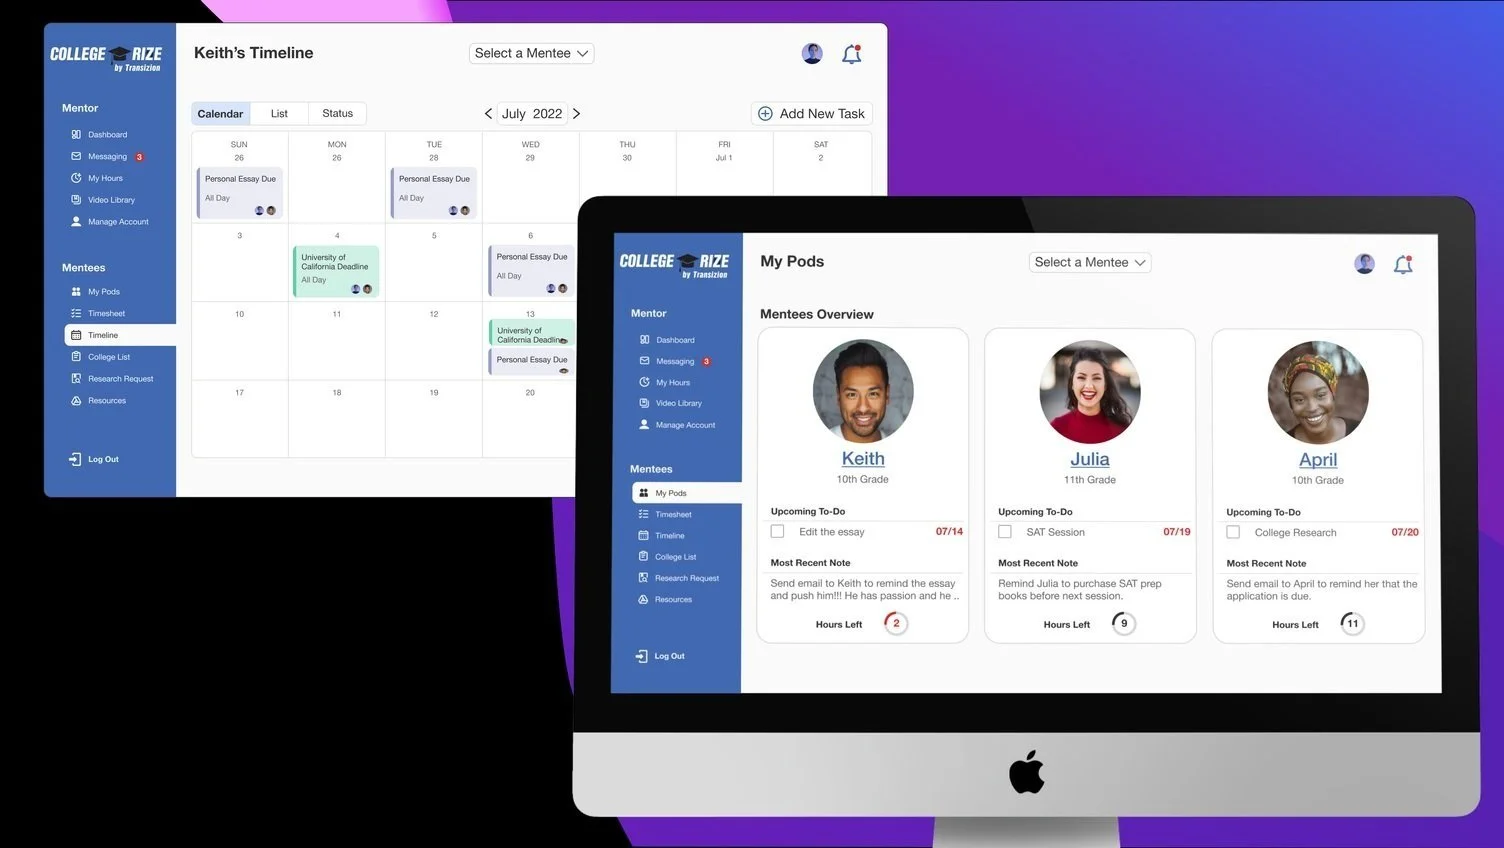
Collegrize: Software Design

Easy Draw: Software Design